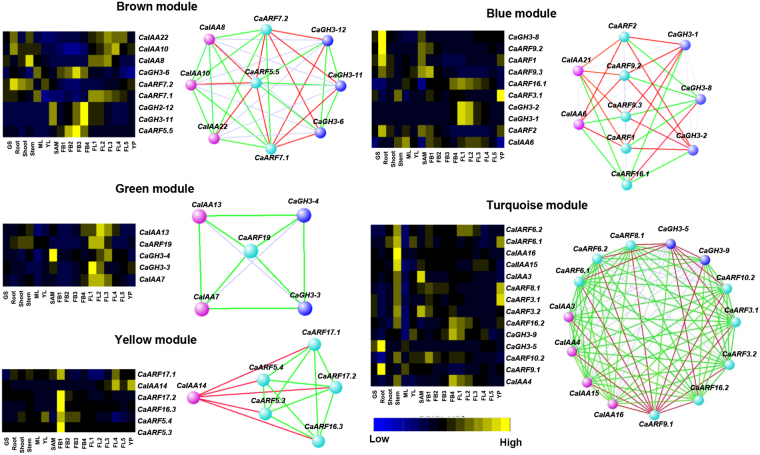
Figure 7.
Co-expression modules and network of CaARF, CaIAA and CaGH3 genes. Left panel shows heatmap depicting the expression of all genes included in each module. Color range from blue (lowest expression) to yellow (highest expression) represent expression level. Right panel shows co-expression network of genes in each module. Network is visualized in ViSANT. Spheres (nodes) represent genes, and green and red color lines (edges) represent positive and negative correlation, respectively.

