
Figure 1.
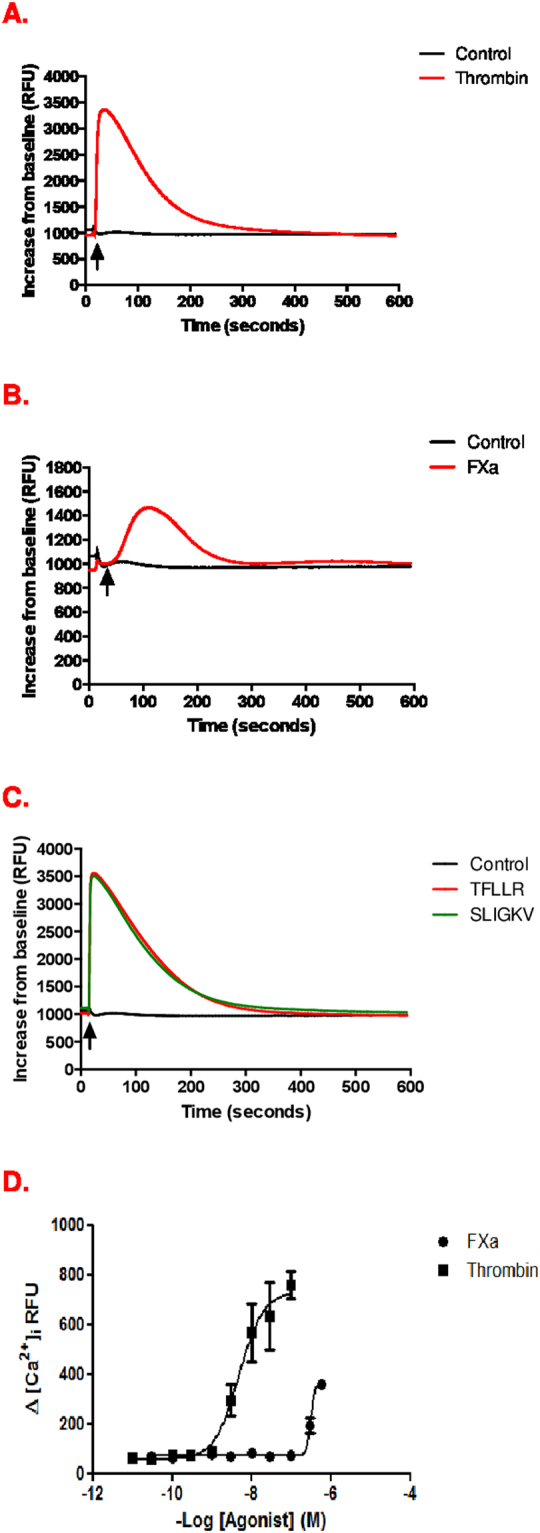
HUVEC response to FXa, thrombin and PAR agonist peptides. Fluo-4 –loaded HUVEC were stimulated by PAR-1 and PAR-2 agonists and fluorescence intensity readings recorded continuously for 10 minutes as described. Data are shown as representative traces of intracellular Ca2+ release upon stimulation with (A) Thrombin (10 nM); (B) FXa (150 nM) (C) PAR-1 agonist peptide TFLLR and PAR-2 agonist peptide SLIGKV. (D) Concentration-response curves in HUVECs following Thrombin (3–30 nM) and FXa (30–150 nM) stimulation.