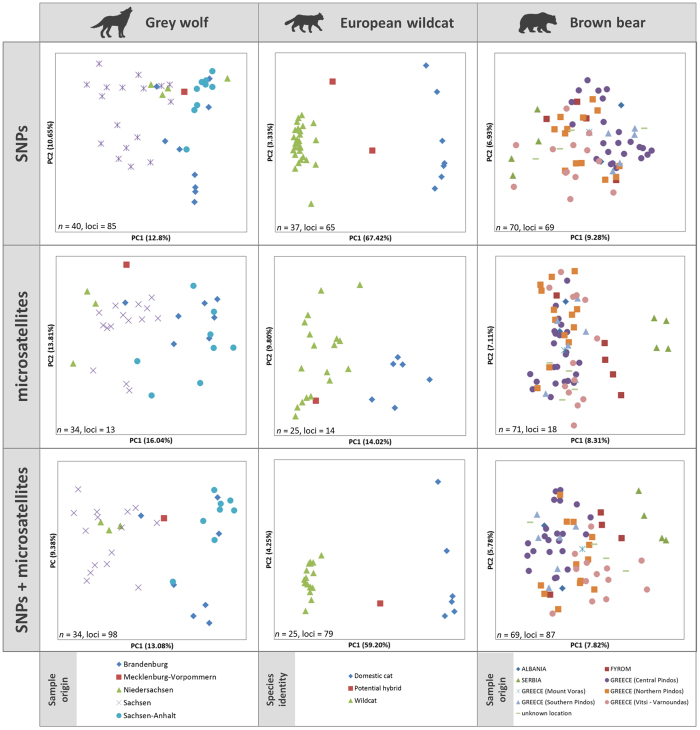
Figure 3.
PCoA analyses of SNP and microsatellite data. Each point represents an individual’s genotype, colour-coded to its sampling region (grey wolves, brown bears) or species identification (wildcats or domestic cats, based on SNP data). In the case of the cats, two potential hybrids were identified with SNPs and one with microsatellites, due to amplification failure of one of the samples with microsatellites. Number of samples and loci included in each analysis are indicated in the lower left corner of each panel.

