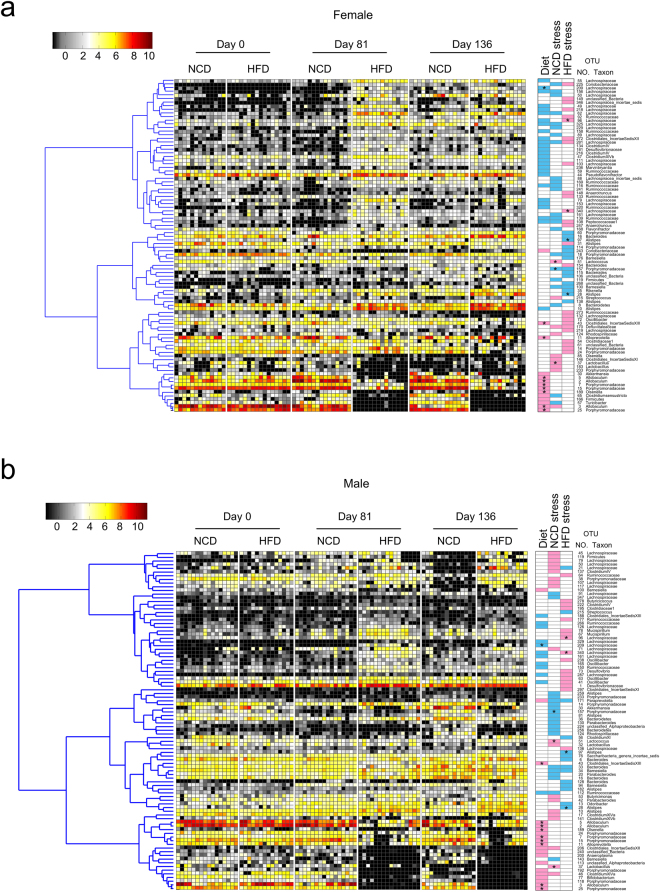
Figure 6.
Stress in females shifted the NCD gut microbiota to resemble the HFD gut microbiota. A combined analysis was performed using Random Forest models to identify all OTUs that changed significantly in response to either diet or stress in (a) female and (b) male mice. OTUs are arranged according to their co-occurrence clusters based on Spearmann correlation coefficients (left side of heat map). The key comparisons and direction of changes are summarized in three columns at right as follows: “Diet” compares NCD mice at Day 81 to HFD mice at Day 81; a blue box indicates that the OTU was higher with HDF, and a pink box indicates that it was lower with HFD. “NCD stress” compares NCD mice at Day 81 (pre-stress) to NCD mice at Day 136 (post-stress); a blue box indicates that the OTU was higher after stress, and a pink box indicates that it was lower after stress. “HFD stress” compared HFD mice at Day 81 (pre-stress) to HFD mice at Day 136 (post-stress); a blue box indicate that the OTU was higher after stress, and a pink box indicates that it was lower after stress. A star means that the OTU responded similarly in female and male mice.

