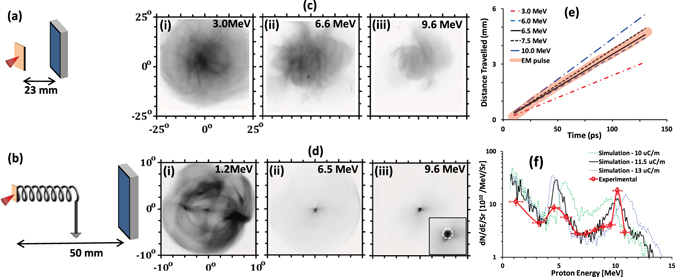
Figure 1.

(a) and (b) show the schematics of the experimental setup, (c) and (d) show the proton beam spatial profiles obtained by the RCF stacks from flat foil and HC targets respectively. The spatial dimensions of the RCF images in (c) and (d) are shown in terms of the angle subtended with respect to the proton sources at the rear side of the foil. The insert in the (d-iii) shows a zoomed- in view of the focussed proton beam at the centre of the RCF image with the white circle showing the coil’s exit aperture. (e) Graph illustrating the synchronisation between the peak of the EM pulse travelling along the coil wire, projected on the coil axis (thick orange line), and the transit of different energy protons along the coil axis (thin lines as mentioned in the figure legend). (f) shows a comparison between on-axis proton beam spectra obtained in case of HC guided proton beam shown in (d), along with the proton spectra obtained from particle tracing simulation carried out for three different EM pulse amplitudes. The spectra were obtained by selecting a small area of 0.4 mm2 at the centre of the beam, corresponding to the exit aperture of the HC target.
