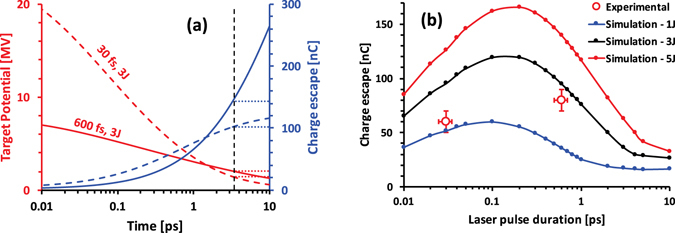
Figure 3.

(a) Temporal evolution of target potential (red) and charge escape (blue) for 3 J, 600 fs (representative of the TARANIS system) - solid line, and 3 J, 30 fs (ARCTURUS system) - dashed line, obtained from the simple phenomenological model described in the text. A laser-to-electron conversion efficiency of 30% was assumed in both cases. The dashed black line indicates the time needed to spread the charge over a 2 mm diameter target disc After this time, target potential and escaped charge for 2mm-sized targets are assumed constant in the model, as indicated by the respective dotted lines. (b) shows the net charge escape from a 2 mm diameter target while varying the laser pulse duration, obtained from modelling of the target charging using the ChoCoLaT code17. The red data points show the total charge contained within the EM pulse measured at the ARCTURUS and TARANIS lasers with (E L, τ, I o) equal to (~1 J, ~30 fs, ~2 × 10²⁰ W cm−2) and (~3 J, ~600 fs, ~2 × 10¹⁹ W cm−2) respectively.
