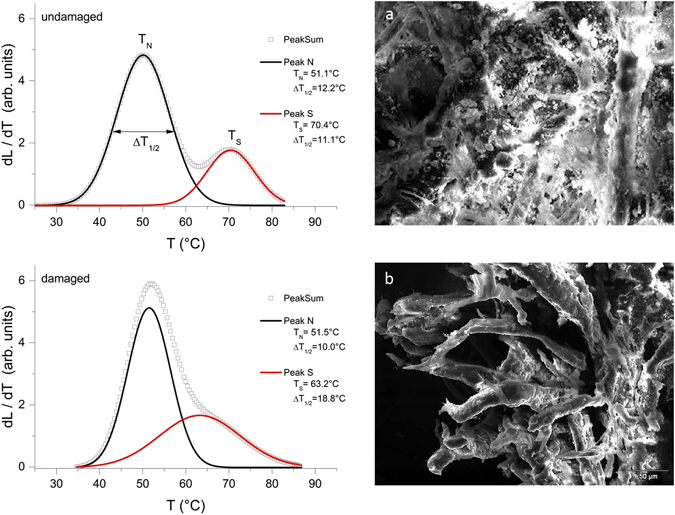
Figure 6.

Structural alterations of the parchment. Left: Light Transmitted Analysis (LTA) curves. In both graphs, the grey curve corresponds to the best fit of the quantity dL/dT, derivative of the light transmitted signal amplitude L as a function of temperature, describing the strength of the overall process of hydrothermal denaturation. Each curve has been deconvoluted in two different peaks associated with the denaturation of different collagen populations having different thermal stability. The peak temperatures TN and TS provide information about the thermal stability of the populations, the higher the peak temperature, the higher is the stability. The full width at half maximum of the peaks T1/2 is related to the homogeneity of the collagen in terms of thermal stability, and therefore to the homogeneity of its preservation state; the lower the homogeneity, the larger is the peak width. Right: Physical appearance of parchment structure (SEM, 350x); (a) undamaged parchment, a diffused matrix encompassing the more robust fibers is clearly evident; (b) damaged sample, the encompassing matrix is completely absent in the damaged portions of the parchment.
