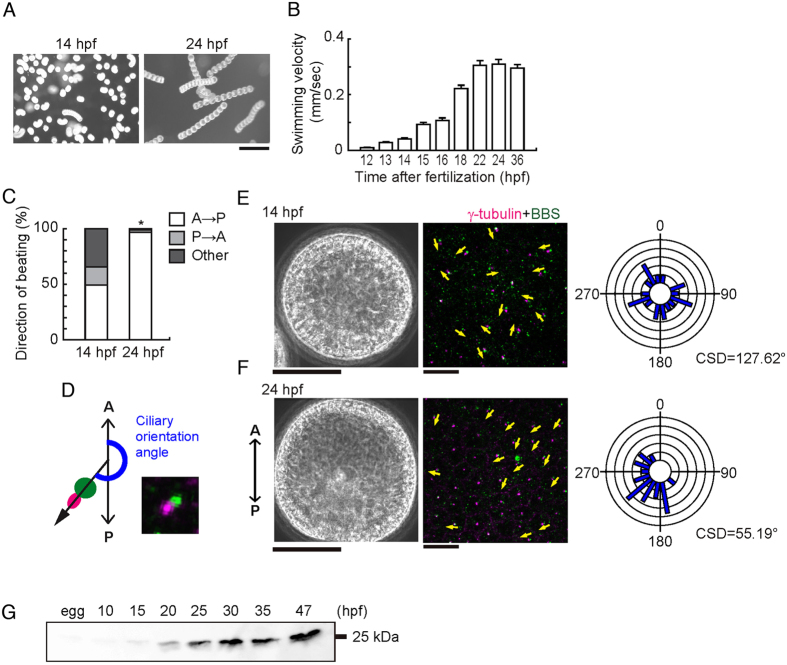
Figure 1.
Ciliary beating direction and basal structure orientation are initially random and then become aligned. (A) Swimming trajectories of embryos. Ten images acquired at 0.3 second intervals are superimposed. hps, hours post fertilization. Scale, 0.5 mm. (B) Mean swimming velocities of embryos of different ages. N = 45–88 from 3–5 embryos. (C) Quantitative comparison of ciliary beating directions. A, anterior; P, posterior. N = 158 (14 h), 125 (24 h) from 8–9 embryos. *p < 0.001. (D) Schematic of angular analysis plotted in E and F. A vector drawn from the cilia transition zone (green) towards the centriole (magenta) gives the direction of ciliary basal structure (black) with respect to the anterior (A) - posterior (P) embryonic axis. A typical immunofluorescence image is shown. (E,F) Phase contrast (left), immunostaining of ciliary basal structures (middle) and circular histograms (right) in two representative embryos at 14 hpf (E) and 24 hpf (F). Yellow arrows indicate the direction in which ciliary basal structures are extended. Scale, 50 μm (left), 10 μm (middle). Circular histograms show the orientation of ciliary basal structures for 23 (14 hpf) and 22 (24 hpf) cilia. CSD, circular standard deviation. (G) Immunoblot of whole embryo proteins with anti-calaxin antibody.

