Fig. 2.

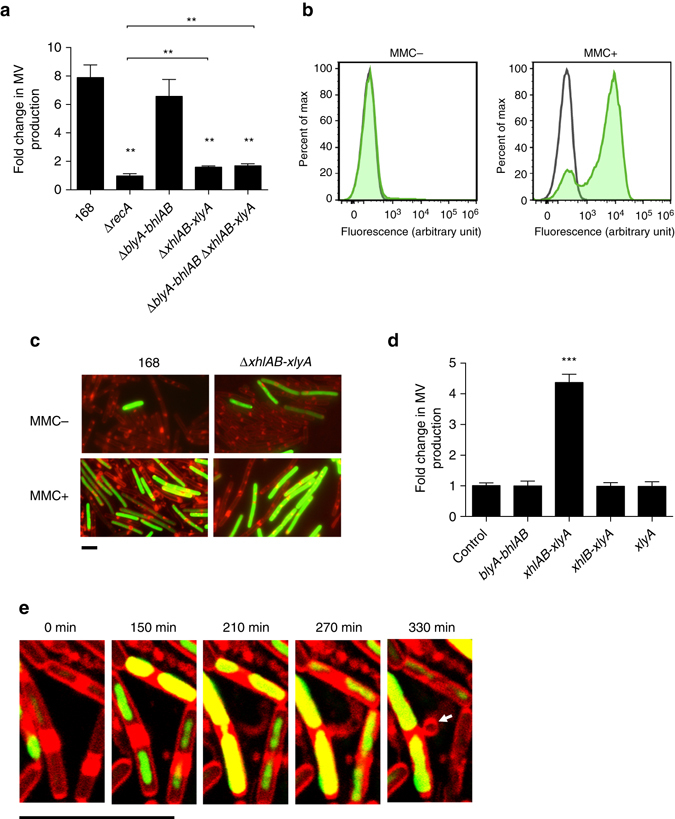
Genotoxic stress induces MV formation through activation of the holin–endolysin system. a Fold-change of MV production of MMC-treated cells relative to non-treated cells. n = 3; mean ± s.d. **P < 0.01 (unpaired t-test with Welch’s correction). b Expression of the PBSX holin–endolysin gene cluster is induced by MMC. A transcriptional fusion of the PL promoter, which drives transcription of the PBSX late operon (including the holin–endolysin genes), to zsGreen was quantified by flow cytometry. Green curve shows activity of the PL promoter; black curve shows activity of the vector control. c Promoter (PL) activities of the PBSX holin–endolysin gene cluster under MMC non-inducing and inducing conditions. The image shows FM4-64 (red) merged with ZsGreen (green). Scale bar, 5 μm. Phase contrast images along with the images of control experiments are shown in Supplementary Fig. 2a. d Fold-change of MV production by the expression of holin–endolysin genes relative to the control strain 168 (PxylA). ***P < 0.001 (unpaired t-test with Welch’s correction). e Live cell imaging of MV formation in B. subtilis 168 (PxylA -xhlAB-xlyA) cells. Arrows indicate MVs. Cells were incubated on LB agarose pads containing 0.1% xylose, FM4-64 (red) and SYTOX green (green). Scale bar, 5 μm
