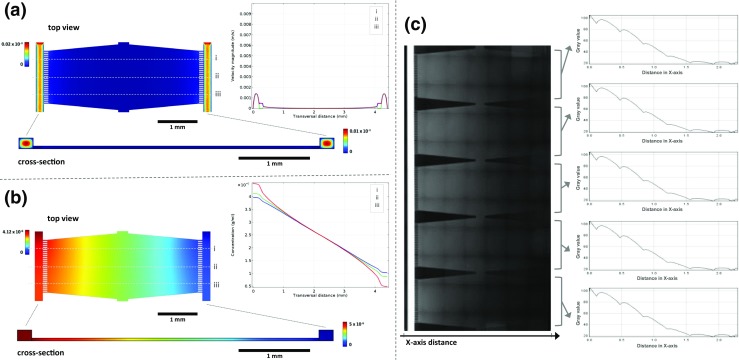
Fig. 3.

Finite Element Modelling of flow regimes and concentration at steady state in a unit of the microfluidic device. Modeled data obtained by FEM of (a) velocity field and (b) concentration in the supply side channels, central culture chamber and the connecting small channels, with the corresponding 2D representations (cross section) and line graphs (representing the three profile lines i, ii, iii). c Fluorescence images montage for characterization of CF™ 568 maleimide dye distribution and graphs showing the mean concentration profiles for each chamber
