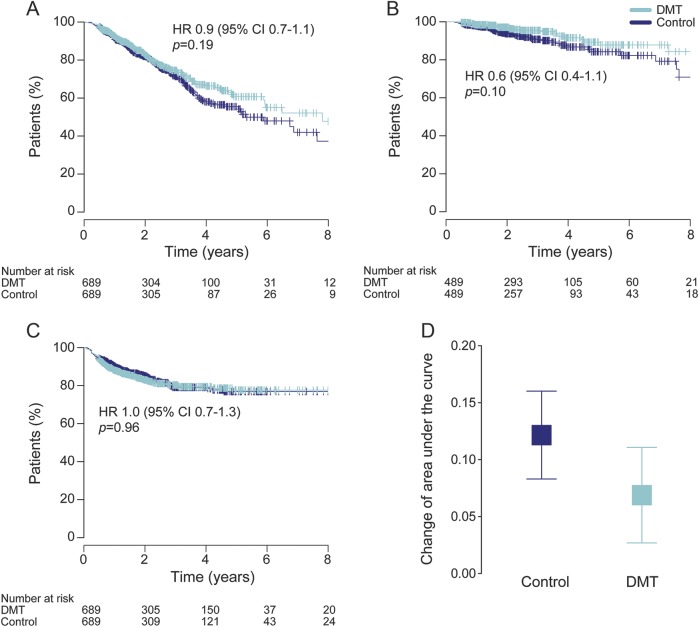
Figure 2. Disability outcomes.
Proportion of patients free from disability progression (A), patients not reaching confirmed EDSS score ≥7 (B), and patients with sustained disability (i.e., no confirmed disability reduction) (C), and change in annualized area under the EDSS-time curve (D) among patients treated (DMT) or untreated (control) with an anti-inflammatory drug. Results of the paired matched analysis with pairwise censoring are shown. Error bars indicate 95% confidence interval (CI). DMT = disease-modifying therapy; HR = hazard ratio.

