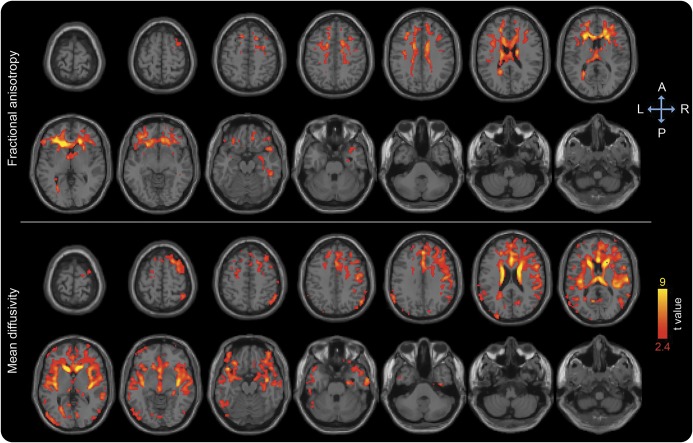
Figure 2. Diffusion tensor imaging (DTI) changes over 1 year regardless of delirium status in multiple linear regression analysis adjusted for delirium severity, age, sex, vascular comorbidity, and baseline general cognitive performance.
Areas showing decrease in fractional anisotropy and increase in mean diffusivity are overlaid to canonical T1-weighted images. Colors refer to t values of significant DTI changes (one-tailed p < 0.05 after correction for multiple comparison within each cluster, cluster size ≥5,000) on a scale of 2.4 (red) to 9 (yellow).

