Figure 1.
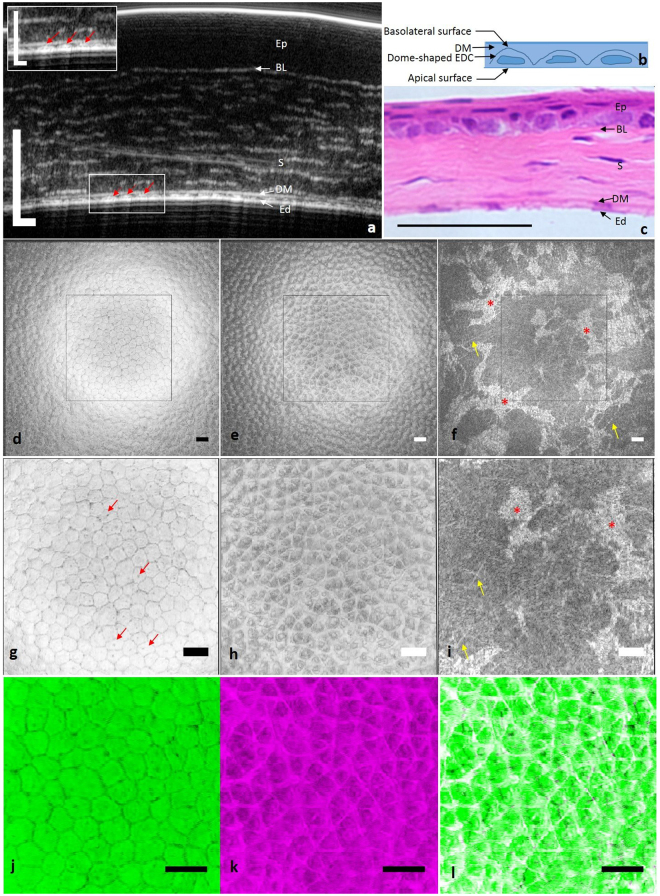
Ex vivo µOCT imaging of mouse cornea. (a) Cross-sectional µOCT image of mouse cornea. Inset is the zoomed-in view of the rectangular area; red arrows indicate endothelial cells. (b) Scheme of the tomographic view of endothelial cells. (c) Cross-sectional histological image of mouse cornea. (d) En face view of the apical side of the endothelium demonstrated regularly arranged polygonal cells with low reflective cell boundaries. (e) En face view of the interface between the endothelium and DM, corresponding to the basolateral side of the endothelium, presented a high scattering lattice. (f) En face view of posterior stroma. Stellate keratocytes (red asterisks) and linear collagen fibres (yellow arrows) were both highly reflective. (g–i) Zoomed-in view of the square region in (d–f). Dark spots are probably primary cilia of endothelial cells (red arrows in g). (j) Apical surface of endothelial cells. (k) Basolateral surface of endothelial cells. (l) Overlap of apical and basolateral surface of endothelial cells. Ep: epithelium; BL: Bowman’s layer; S: stroma; DM: Descemet’s membrane; Ed: endothelium; EDC: endothelial cell (Scale bar = 50 µm and scale bar of inset in (a) represents 25 µm).

