
Figure 4.
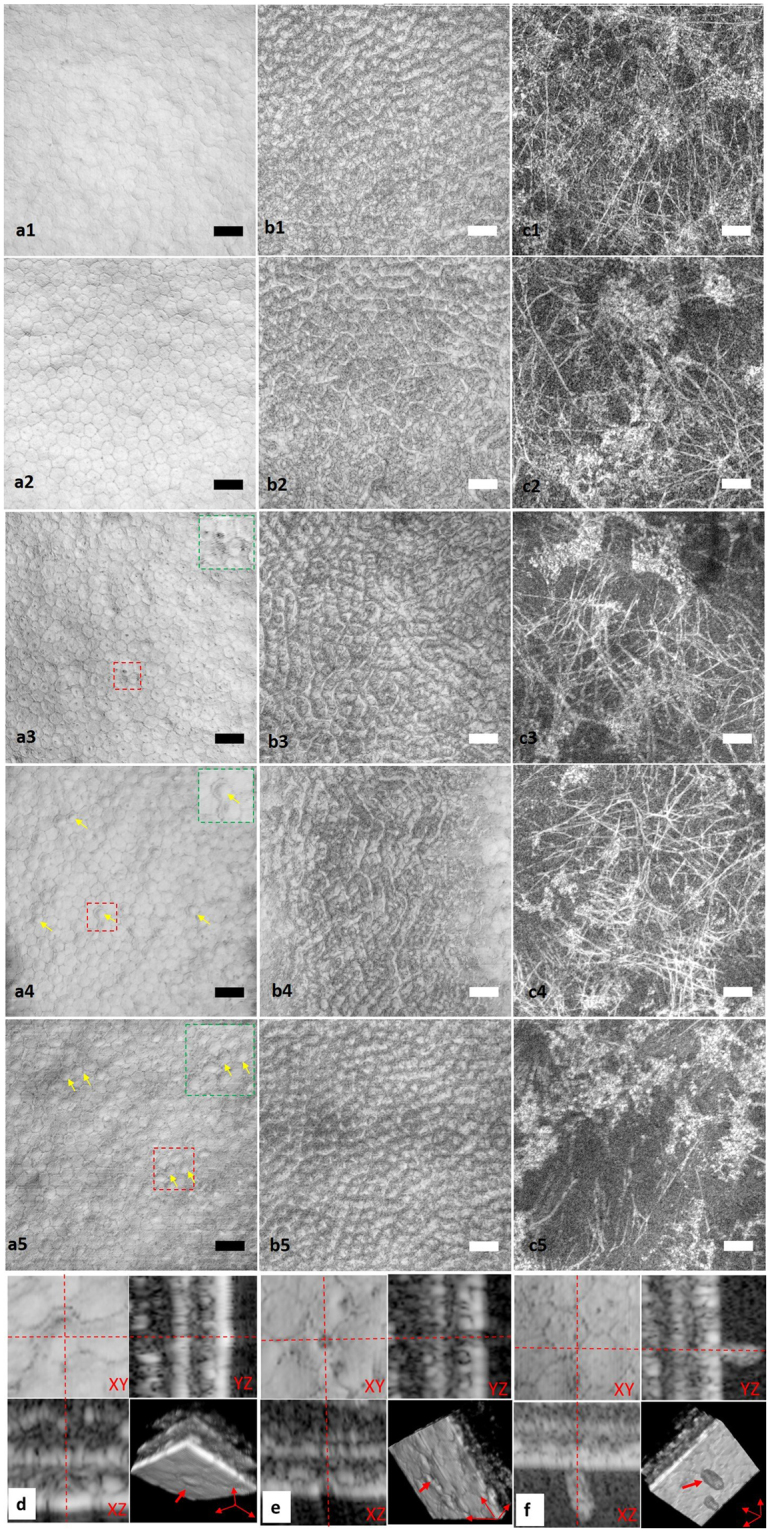
Longitudinal ex vivo observation of rat central cornea with µOCT. En face views taken at <5 mins (a1–c1), 2 h (a2–c2), 4 h (a3–c3), 8 h (a4–c4) and 24 h (a5–c5). (a1–a5) En face view of apical side of endothelial cells. Green square insets are zoomed-in view of red square areas in (a3,a4 and a5), respectively. Yellow arrows in (a4 and a5) indicate endothelial cell swelling, which changed the cell surface from flat to dome-shaped. (b1–b5) En face view of the basolateral surface of endothelial cells and the interface between endothelium and Descemet’s membrane. A high scattering lattice was detectable at all these time points. (c1–c5) En face view of posterior stroma. Highly reflective collagen fibres and keratocytes are both visible at different time points, whereas the density of collagen fibres appears to decrease at 24 hours after sacrifice. (d) 3D view of deformation of endothelial cells. Red arrow indicates dome-shaped deformation of endothelial cells at the apical surface. (e) 3D view of endothelial defect (red arrows). (f) 3D view of leukocyte infiltration into the cornea from cell boundaries (red arrow) (Scale bar = 50 µm).