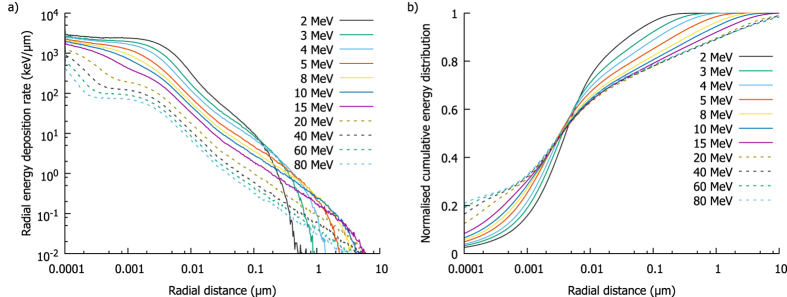
Figure 3.
Radial energy deposition around protons of different energies. In (a), rate of energy deposition as a function of distance from the primary track shows an increasing amount of energy is deposited as particles slow, with the greatest density within a few nm of the track. However, (b) shows a normalised cumulative energy distribution as a function of distance from the track. Due to the small volume near the track the total energy deposited energy is relatively small, with a large fraction of deposited at long distances, even beyond 1 μm for the most energetic protons.

