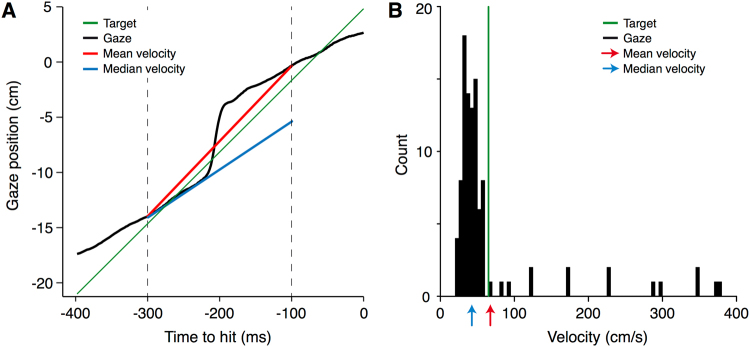
Figure 2.
Method used to calculate the pursuit gain. (A) The gaze position on one trial, as a function of the remaining time until the moment of the tap (black curve). The two vertical dashed lines indicate the borders of the period that we use to evaluate the pursuit gain. (B) Histogram of the 100 samples of gaze velocity during this period. Note that the median velocity (blue line and arrow) is a reasonable estimate of the smooth component of tracking, despite the presence of the saccade. The extent to which the mean velocity is influenced by the saccade is also shown (red line and arrow). The target’s position and velocity are shown in green.

