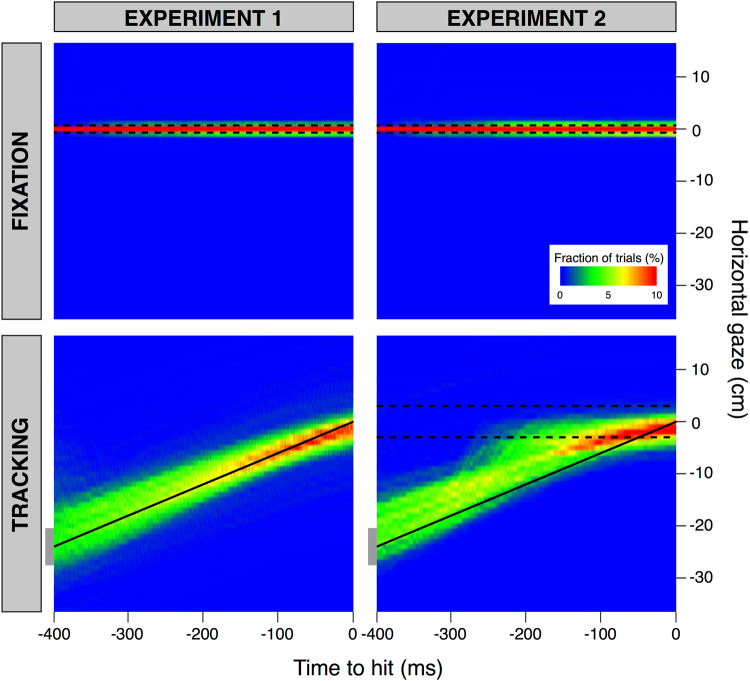
Figure 4.
Heat maps of the horizontal distance of gaze from where the structure that subjects had to fixate was situated at the time of the tap, as a function of the remaining time until the moment of the tap. The structure that subjects had to fixate was the fixation point for the Fixation condition (upper panels) and the target for the Tracking condition (lower panels). Blue indicates that people seldom looked at the position in question at that time. Red indicates that they often did so. The dashed black lines indicate the maximal horizontal extent of the area within which subjects had to tap on the target (subjects were free to intercept the target wherever they liked in the Tracking condition of Experiment 1). The black line in the lower panels indicates the average position of the target at each moment (i.e. the position for a velocity of 60 cm/s). The grey rectangles at the left ends of these black lines indicate the size of the target.

