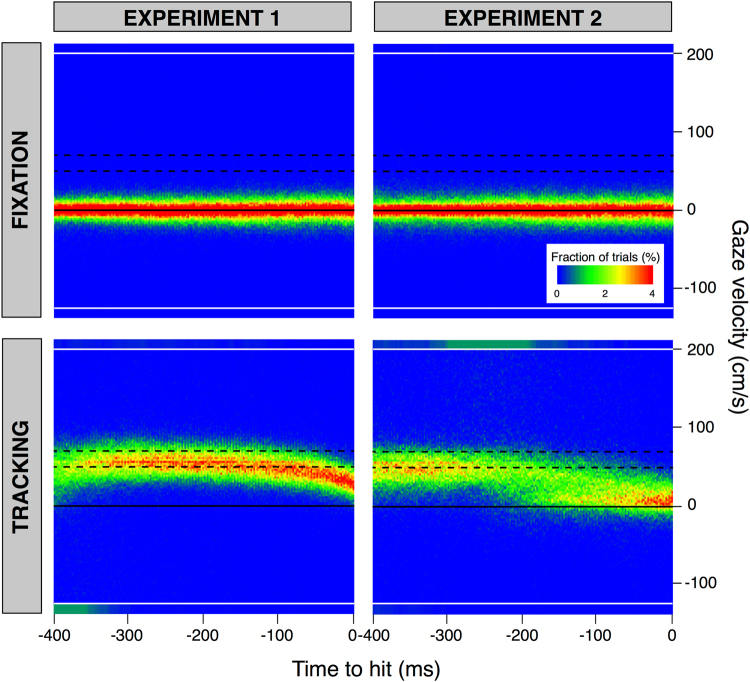
Figure 5.
Heat maps of the horizontal gaze velocity as a function of the remaining time until the moment of the tap. The black line indicate a velocity of 0 cm/s. The dashed lines indicate the range of target velocities. The sections above and below the white lines represent the cumulative occurrences of values above 200 cm/s and below −125 cm/s, respectively. Such velocities are indicative of saccades. To give a graphical impression of the relative frequency of saccades, the fractions of trials within these sections are scaled to match the area in which these cumulative occurrences are represented: the height of each of these areas corresponds to that of five bins, so we divided the cumulative occurrences of values above 200 cm/s (and of values below −125 cm/s) by five.

