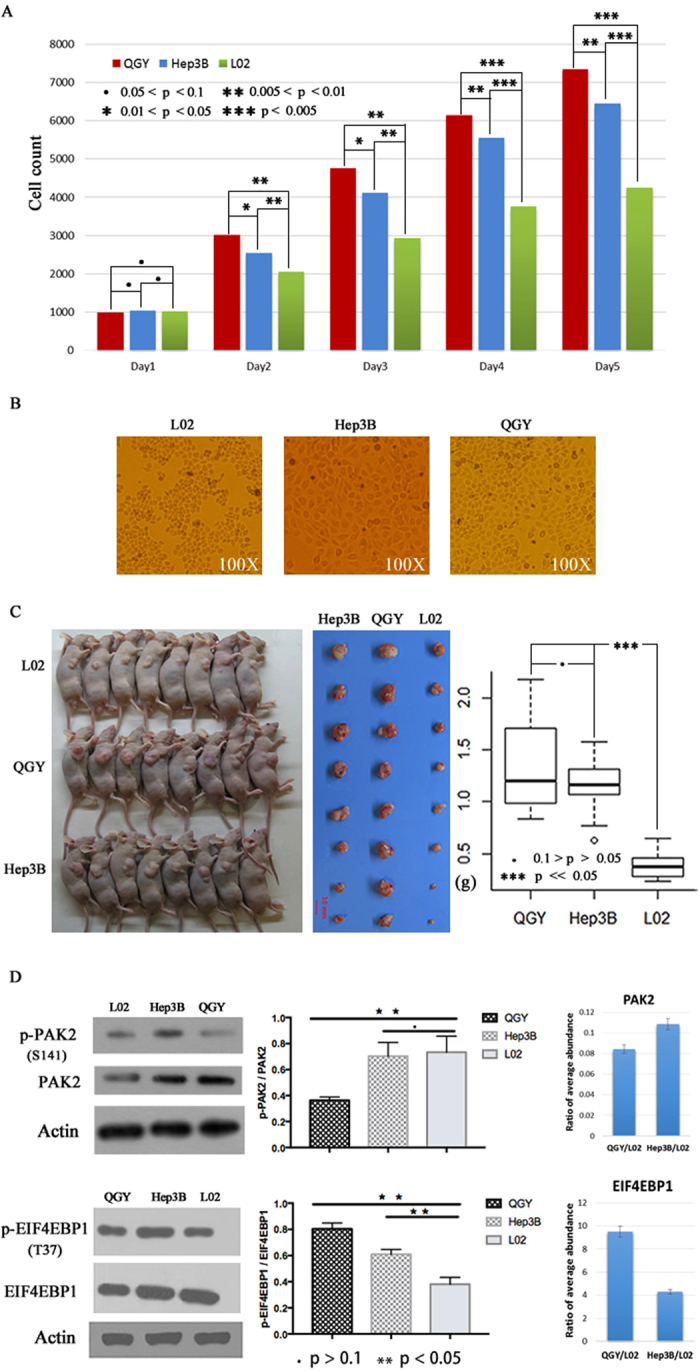
Figure 1.

The distinct proliferation potential of three liver cell lines. (A) The proliferation of three liver cell lines under the same initial cell number and culture condition from day 1 to day 5. (B) The morphology of cultured three cell lines at day 5 under 100X microscope. (C) The results of proliferation assay using nude mice model. (D) The western blot results of phosphorylated sites T46 of EIF4IBP1 and S141 of PAK2, the middle graph is the statistical results of western blot based on densitometric analysis. The right bar charts compare the relative abundance of phosphorylated PAK2 and EIF4BP1 in QGY and Hep3B to L02 by MS/MS method.
