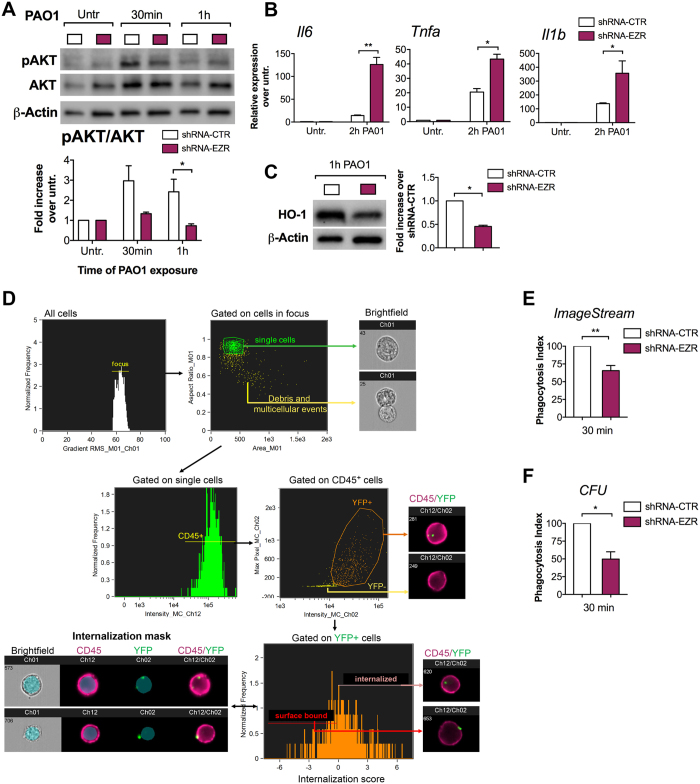
Figure 3.
Ezrin is necessary for P. aeruginosa phagocytosis in MΦs. (A) WB and densitometric analysis for pAKT and AKT in J774A.1 shRNA-CTR (white bar) and J774A.1 shRNA-EZR (purple bar) cells untreated or treated with PAO1 for the times indicated. Bar graph represents the pAKT/AKT ratio. Protein fold increase is normalized to β-Actin. (B) qPCR for IL-6, TNF-α and IL-1β in shRNA-CTR or shRNA-EZR cells, untreated or treated with PAO1. Pro-inflammatory cytokine expression is normalized to S18. (C) WB and densitometric analysis for HO-1 in shRNA-CTR or shRNA-EZR treated 1 h with PAO1. Protein fold increase is normalized to β-Actin. (D) Representative images showing the gating strategy used to evaluate phagocytosis of PAO1 bacteria (30 min of exposure) by murine J774A.1 cells expressing the shRNA-CTR or shRNA-EZR and stained with CD45. Briefly, a gate was set on cells in best focus (i) and debris and multi-cellular events were excluded to restrict analysis to single cells (ii). CD45 + single cells were gated (iii) and, out of this population, YFP + events were selected (iv). To discriminate between internalized from cell surface-bound bacteria, we created an internalization mask (iv). This internalization mask was then applied to all YFP+ cells to calculate the internalization score (vi). Cells receiving an internalization score equal to or greater than 0, were considered to contain intracellular bacteria. For details of the ImageStream gating strategy, please refer to the online supplemental experimental procedures and Supplementary Fig. S5. (E) Percentage of J774A.1 shRNA-CTR and shRNA-EZR cells that internalized YFP-PAO1. (F) Colony-forming unit (CFU) assay for J774A.1 shRNA-CTR or J774A.1 shRNA-EZR cells exposed to PAO1 for 30 min. Phagocytic index is expressed as the percentage of J774A.1 shRNA-EZR cells that internalized PAO1 (E) or the percentage of PAO1 CFUs (F) over control. For each experiment the following multiplicities of infection (MOIs) bacteria: cells were used: (A–C) 20:1, (D–E) 100:1 and (F) 20:1. For each experiment, data are representative of three experimental biological repeats. Error bars indicate standard deviation. Symbol * indicates a statistically significant difference between the experimental group and control group (P < 0.05). Cropped blots are displayed and full-length gels and blots are included in a Supplementary Figure S8.

