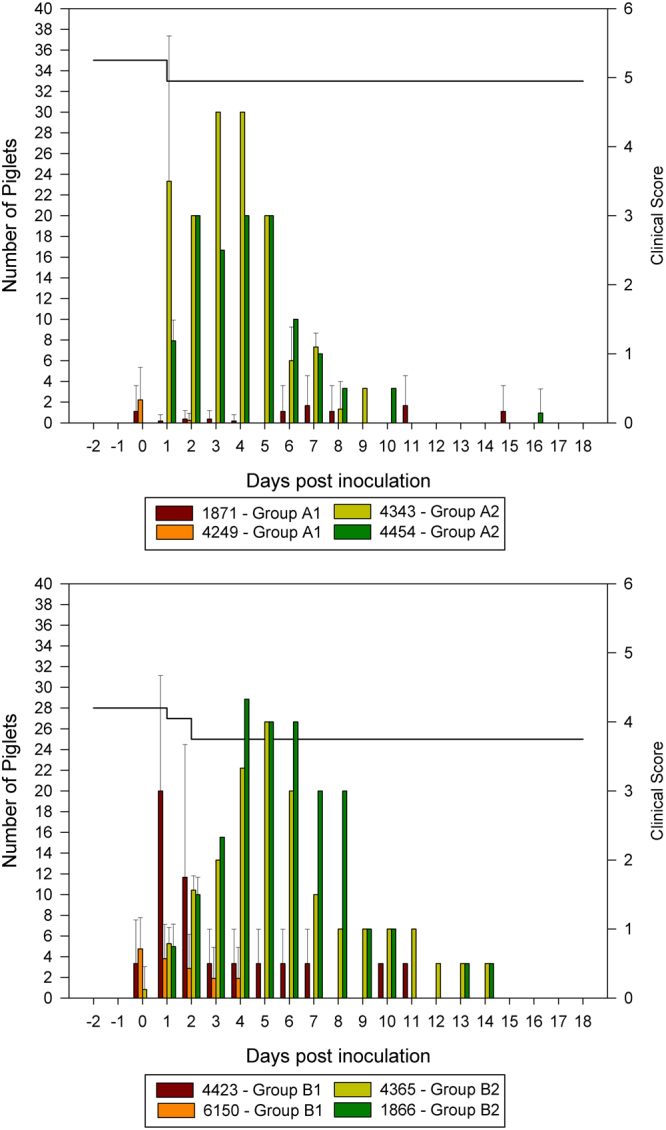
Figure 1.

Cumulative clinical scores and piglet survival shown per litter per sow: The bars indicate the clinical scores of each litter per sow and the black line across the top of the graph represents the number of surviving piglets over time; upper chart: animals inoculated with cell culture adapted PEDV-strain (Group A1 (sows 1871 and 4249) and A2 (sows 4343 and 4454)), lower chart: animals inoculated with German field material (Group B1 (sows 4423 and 6150) and B2 (sows 4365 and 1866)), standard deviation is shown in error bars.
