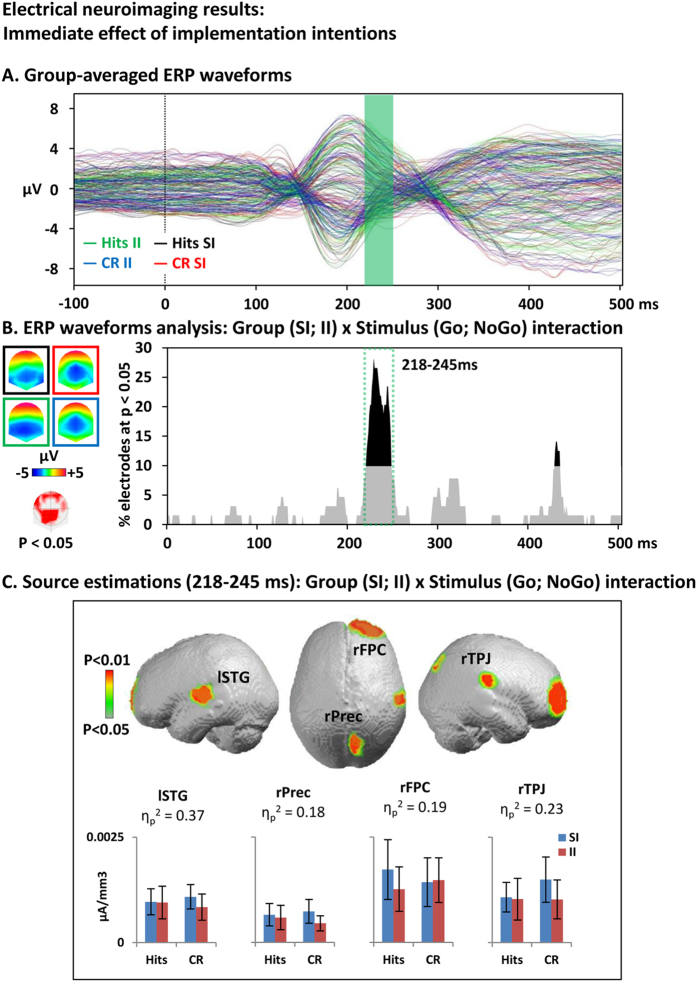
Figure 2.
Electrical neuroimaging analysis of the immediate effect of implementation intentions. (A) Group-averaged event-related potentials (ERP) for hits to Go trials in the standard instructions (SI) group (black line) and implementation intentions (II) group (green) and for correct rejections to NoGo in the SI group (red) and the II group (blue). (B) Electrode-wise statistical analyses of the ERPs. The graph depicts for each post-stimulus time point the percentage of electrodes showing a significant Group x Stimulus interaction (p < 0.05). The 218–245 ms period showed a sustained interaction effect (> 10 ms for > 10% of the electrodes; green dotted square). The topographic map (nasion upward) represents in red the electrode sites showing a significant interaction, and on the left the topographies of the ERPs for all groups and conditions (same colors as in A). (C) Statistical analysis of the distributed electrical source estimations over the period defined in (B). (p < 0.05; KE = 15). SI: control group receiving standard instructions; II implementation intentions group; CR: correct rejection; KE: spatial extent criterion.

