
Fig. 3.
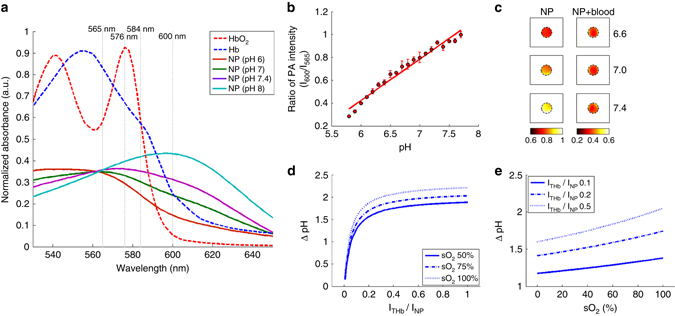
Limitation of dual-wavelength ratiometric photoacoustic imaging of pH. a Spectroscopic optical absorption of oxygenated hemoglobin (HbO2), deoxygenated hemoglobin (Hb) and SNARF-PAA NPs at different pH levels. b Measured PA signal amplitude ratios between the two wavelengths (600 nm/565 nm) as a function of pH (pH 5.8–7.8 with 0.1 pH interval) (n = 3, error bars represent standard deviations). By performing a linear fitting of the scattered measurements in the range of pH 5.8–7.8, a calibration line was generated. c The PA ratiometric images (600 nm/565 nm) of phantoms containing SNARF-PAA NPs buffered at pH 6.6, 7.0 and 7.4, respectively. The nanoparticle (NP) images are for phantoms with NPs and the NP + blood images are for phantoms with NPs containing blood (1% w/w). The color scale represents the ratio between the PA intensities at the two wavelengths (600 nm/565 nm). d Estimated errors (i.e., ΔpH) in dual-wavelength ratiometric PA pH measurement as a function of the ratio between the PA signal amplitudes from total hemoglobin (THb) and SNARF-PAA NPs (i.e., ITHb/INP). The three curves are for three different hemoglobin oxygen saturation (sO2) levels (50, 75 and 100%). e Estimated errors (i.e., ΔpH) in dual-wavelength ratiometric PA pH measurement as a function of the blood sO2. The three curves are for three different ratios of ITHb/INP (0.1, 0.2 and 0.5)