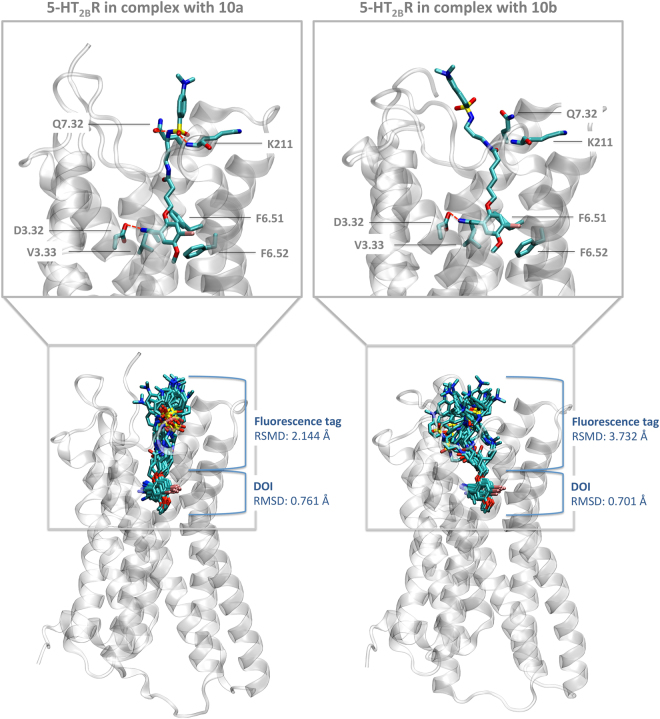
Figure 3.
Three-dimensional complexes of the fluorescent probes 10a (left) and 10b (right) bound to the 5-HT2B receptor obtained from extended molecular dynamics simulation with a total time of 1.6 μs (2 times × 800 ns). The upper panel highlights ligand-receptor interactions of a representative structure. The lower panel includes information about the dynamic properties and stability of the ligand binding by depicting frames each 50 ns along a total simulation time of 800 ns. The RMSD values are calculated for DOI or the fluorescent tag with respect to the average structure at 800 ns.

