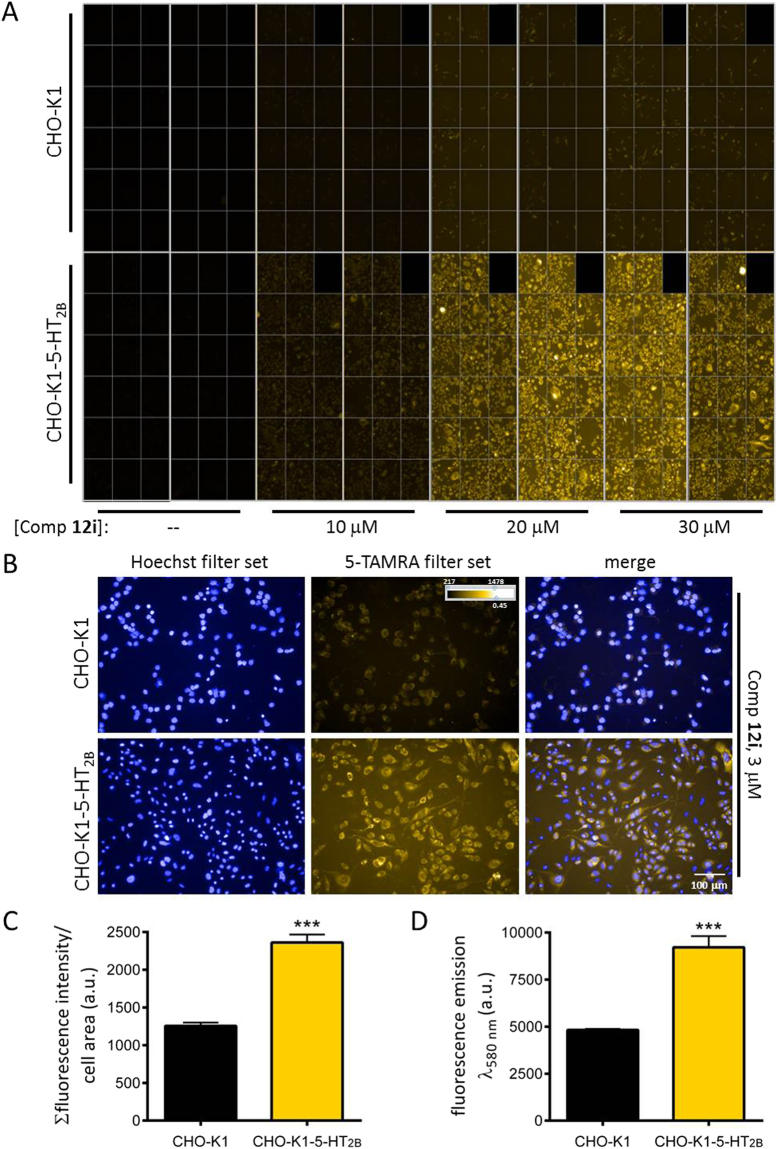
Figure 9.
Labelling of 5-HT2B receptors by compound 12i in cells. (A) Living parental untransfected CHO-K1 cells (CHO-K1) and CHO-K1 cells stably expressing 5-HT2B receptors (CHO-K1-5-HT2B) were incubated in the absence or presence of the indicated concentrations of compound 12i and, after compound removal, fluorescence images (excitation wavelength 520–550 nm, emission wavelength 560–630 nm, standard filter set for 5-TAMRA) were acquired using an automated high content imaging instrument at 20x magnification. (B) Sample images from CHO-K1 and CHO-K1-5-HT2B cells labelled with 1 µg/mL Hoechst 33342 (for nuclear staining) and compound 12i at a concentration of 3 μM, sampled from those quantified in (C,D). Minimum and maximum intensity and gamma correction of the images are shown in the colour scale in the panel. (C,D) Quantification of the fluorescence emission of compound 12i in images from CHO-K1 and CHO-K1-5-HT2B cells labelled with 1 µg/mL Hoechst 33342 (for nuclear staining) and compound 12i at a concentration of 3 μM, both by image analysis (C) and by direct fluorescence measurement using a plate reader (D). The graphs show mean ± SEM of 4 wells, 5 fields/well (image analysis) and mean ± SEM of the same wells (plate reader). ***p < 0.001, two-way ANOVA and Bonferroni post tests.

