Figure 3.
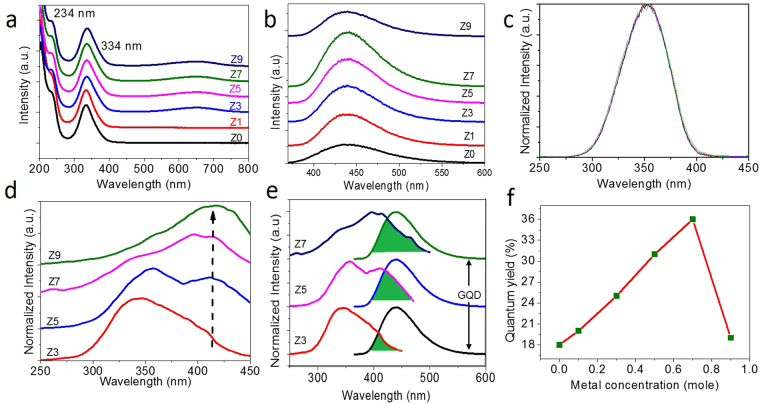
Optical properties of GQDs and GQD solid sheet structures. (a) UV-Vis absorption spectra of Z0-Z9 raw samples. It shows two absorption bands at 234 and 334 nm correspond to the π-π* (C=C) and n-π* (C=O/C=N) transitions, respectively, (b) emission spectra of raw samples showing increase in emission intensity upto Z7 and further a decrease for Z9 sample, (c) excitaion spectra of raw samples showing peak maxima at 350 nm, (d) excitation spectra of separated solid sheets show the shift in peak maxima from 350 to 410 nm for samples prepared with higher metal concentration, (e) spectral overlap between excitation of solid sheet samples [Z3, Z5 & Z7] and emission of GQD samples (f) A graph representing the quantum yield values as function of metal concentration in our samples. The excitation, emission, and quantum yield values are given as comparative table in the Supplementary Table S1.

