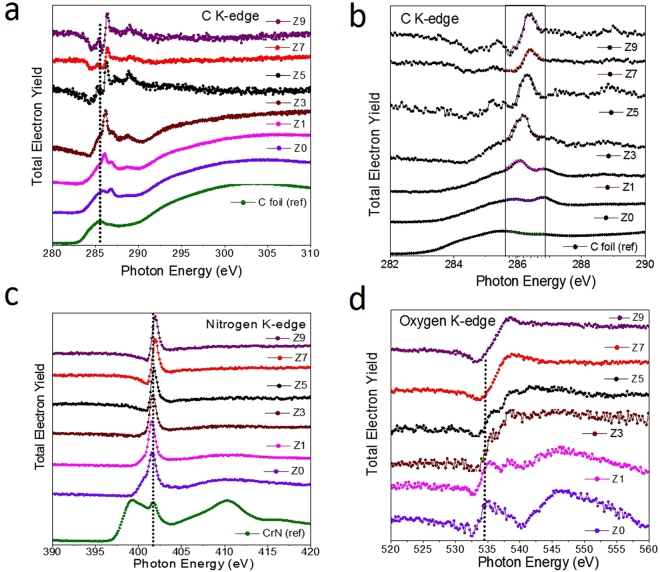
Figure 7.
X-Ray absorption spectroscopy measurements of GQDs and GQD solid sheet structures at C, N and O K-edges. (a) C K-edge spectra of GQDs and solid sheet samples (Z0-Z9), (b) enlarged C-K edge spectra showing the rise of excitonic peak at 286.3 eV with metal doping effect, (c) N K-edge showing the presence of graphitic nitrogen with a sharp peak at 401.1 eV, (d) O K-edge spectra showing the presence of C-O and C=O in our samples.

