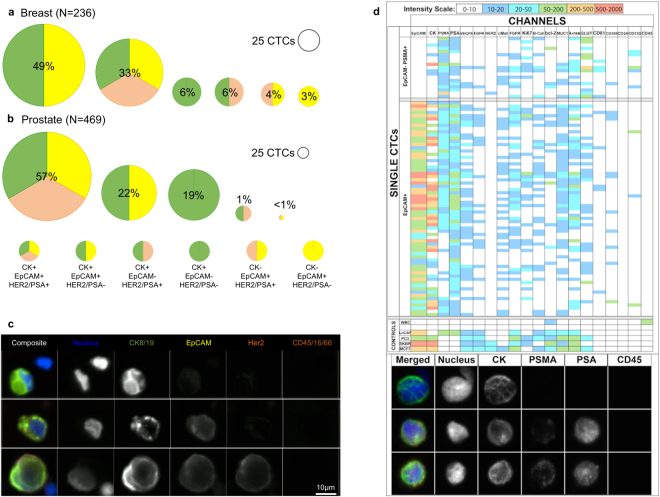
Figure 3.
Heterogeneity of Cells Collected – Proportions of collected CTCs in different bins based upon positivity of surface and intracellular markers from (a) breast cancer patients and (b) prostate cancer patients. (c) Example images of CTCs from a single breast cancer patient. (d) Top panel: Table view of single CTCs identified via their positivity for PSMA and/or EpCAM (top rows) and control cell lines or white blood cells (bottom rows, represents median). Each row represents a single nucleated event and each column represent a channel detecting specified antigen. Color scale is denoted in the bottom, with white representing signal below S/N threshold set based upon controls. Bottom panel: a parallel slide based analysis of the same sample confirmed positive cells and their immunostaining for tumor marker. We detected 45 CTCs from slide-based analysis and 86 from mass cytometry based analysis from a total of 12 mL blood. (CK: cytokeratin, PSMA: prostate specific membrane antigen, PSA: prostate specific antigen).

