Figure 1.
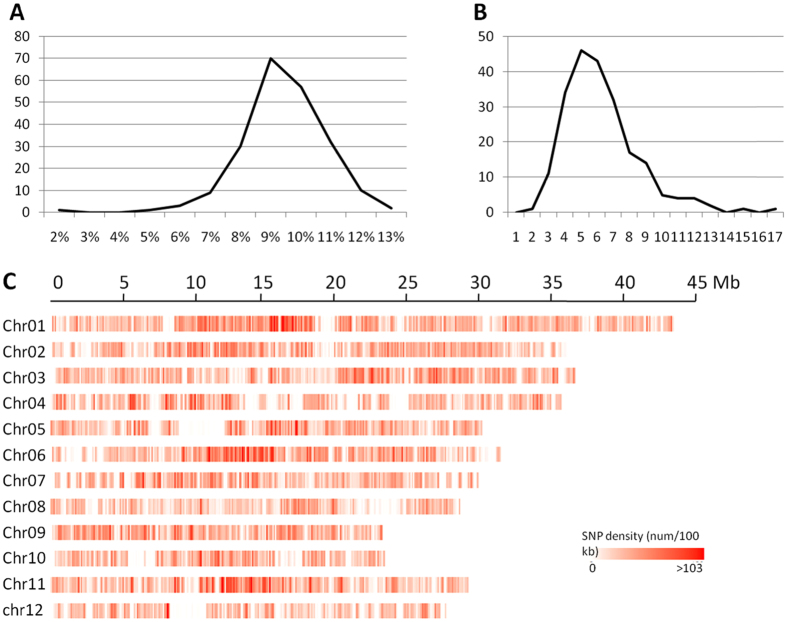
Sequencing results for the RILs population. (A) Coverage distribution in the RILs population. The horizontal axis represents coverage and the vertical axis indicates the number of individual lines. (B) Distribution of sequencing depth in the RILs population. The horizontal axis represents the sequencing depth and the vertical axis indicates the number of individual lines. (C) Heat map distribution of SNPs on each chromosome of the rice genome.

