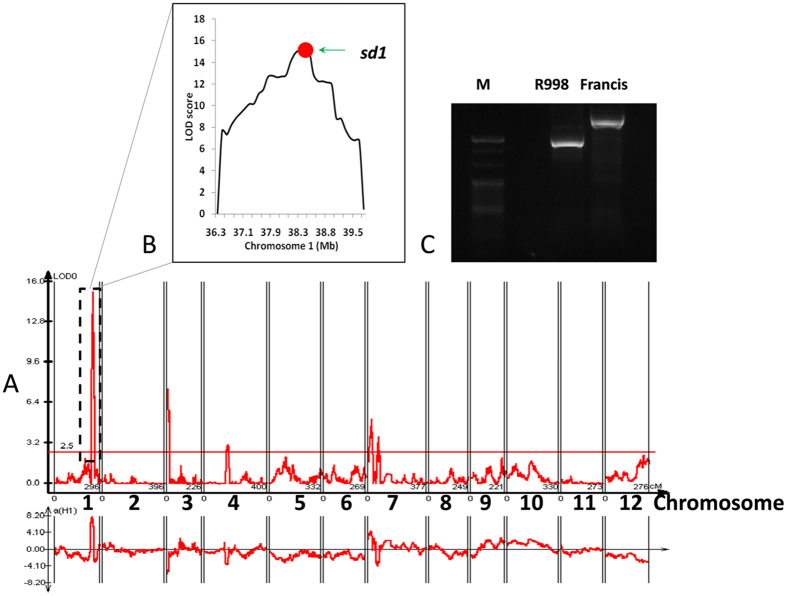
Figure 2.
Mapping of QTLs controlling plant height in RILs population and the location of sd1. (A) Mapping curve of QTLs controlling plant height on 12 chromosomes.Curves in plot indicate the genetic or physical coordinate (X-axis) and LOD score (Y-axis) of detected QTL. (B) The box inside is the zoom-in image of the peak on chromosome 1. Red dot presents the relative physical position of sd1 gene. (C) Genotyping of the two parent lines using a functional marker of sd1. M, 20 bp ladder (TaKaRa).

