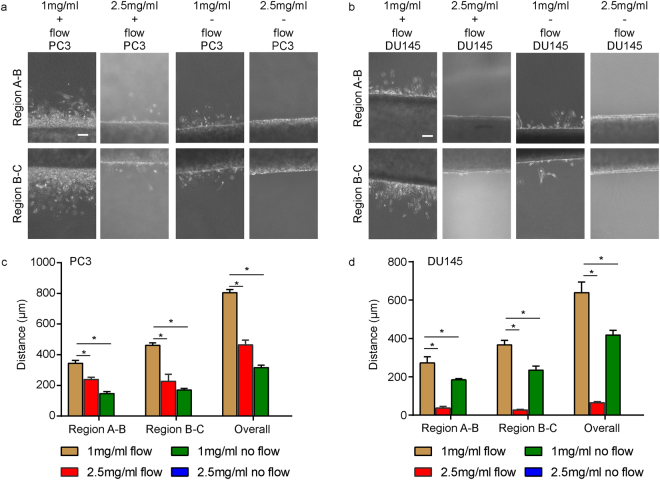
Figure 2.
Modulating collagen concentration or flow affects cancer cell invasion. (a) Phase images of PC3 cells grown under different conditions of collagen density (1 mg ml−1 or 2.5 mg ml−1) or flow (+ flow or − flow). Region A-B is shown on the top row while region B-C is on the bottom row. (b) Phase images of DU145 cells grown under different conditions of collagen density (1 mg ml−1 or 2.5 mg ml−1) or flow (+ flow or − flow). Region A-B is shown on the top row while region B-C is on the bottom row. Scale bars = 100 μm. (c) Maximum invasion distance of PC3 cells grown in tumoroids under different conditions as indicated. (d) Maximum invasion distance of DU145 cells grown in tumoroids under different conditions as indicated. Data were plotted as the mean ± s.e.m, with n = 3 biological replicates. P-values were calculated using two-tailed unpaired t-test with respect to control (1 mg/ml control). *P < 0.05.

