Figure 5.
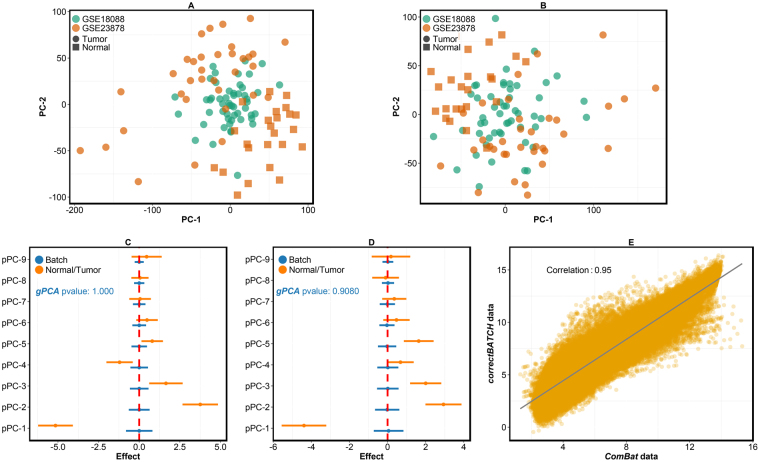
Correction of batch effect in CRC and normal gene expression datasets whilst retaining biological effects. (A,B) PCA plots showing clustering of samples (the two CRC datasets – GSE18088 and GSE23878) after batch correction using correctBATCH (A) and ComBat (B). (C,D) Forest plots from findBATCH show batch (blue) and normal/tumor biological effect (orange) associated with batch corrected data from (C) correctBATCH and (D) ComBat. pPCs are considered significant only if 95% CIs do not include zero. The gPCA p-values of 1.000 and 0.908 for correctBATCH and ComBat, respectively, are shown. (E) A plot showing Pearson correlation between batch-corrected data from correctBATCH and ComBat methods.

