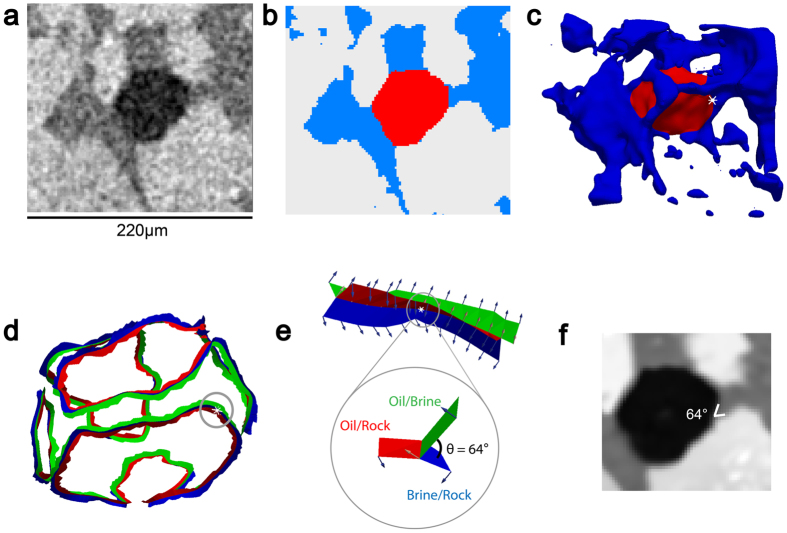
Figure 1.
Example of an automatic contact angle measurement. (a) Raw image of a weakly water-wet sub-volume containing a single trapped oil ganglion with oil, brine and rock in black, dark grey and light grey respectively. (b) Segmented image with oil, brine and rock in red, blue and white respectively. (c) Three-dimensional image of generated smoothed surfaces by the automated algorithm, showing the trapped oil ganglion in red and surrounding brine in blue with a selected measured point at the white dot. (d) Three-phase contact line with the same point highlighted by the grey circle. (e) Magnified view of the three-phase contact line highlighted in (d) showing vectors to the interfaces, and a magnified view of the measured contact angle example of 64°. (f) The same measurement is superimposed on the filtered image at the same location.

