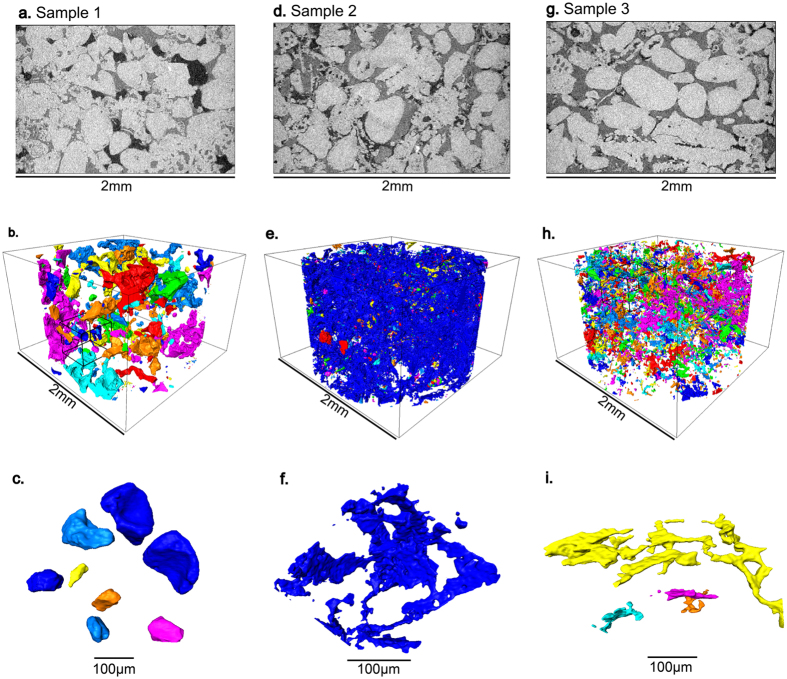
Figure 5.
Two-dimensional cross-sections of three-dimensional X-ray micro-tomographic images (upper figures) and three-dimensional renderings of the remaining oil saturation after waterflooding (middle figures) with magnified images of oil ganglia (lower figures) that are highlighted in smaller black cubes within the larger images (middle figures). Samples 1, 2 and 3 are shown in (a,b,c), (d,e,f) and (g,h,i) respectively. The colors show different oil ganglia that appear trapped at the resolution of the image.

