Figure 8.
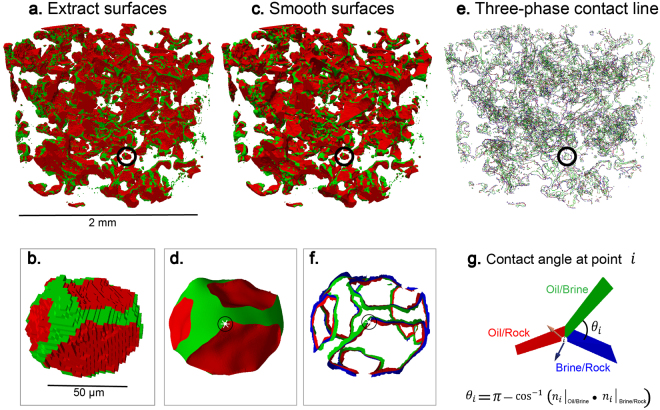
Automatic in situ contact angle measurement workflow demonstrated on oil ganglia in Sample 1 with a magnified view of a single trapped oil ganglion highlighted in the black circle. Rock and brine were rendered transparent. (a,b) Extracted oil-brine surface (green) and oil-rock surface (red). (c,d) Smoothed surfaces with a selected example point indicated by the white dot. (e,f) Three-phase contact line with oil-brine surface (green), oil-rock surface (red) and brine-rock surface (blue) with the same selected example point highlighted by the back circle. (g) Contact angle measurement of 52° at the selected point from the vector dot product of the oil-brine interface and rock interface vectors.

