
Figure 3.
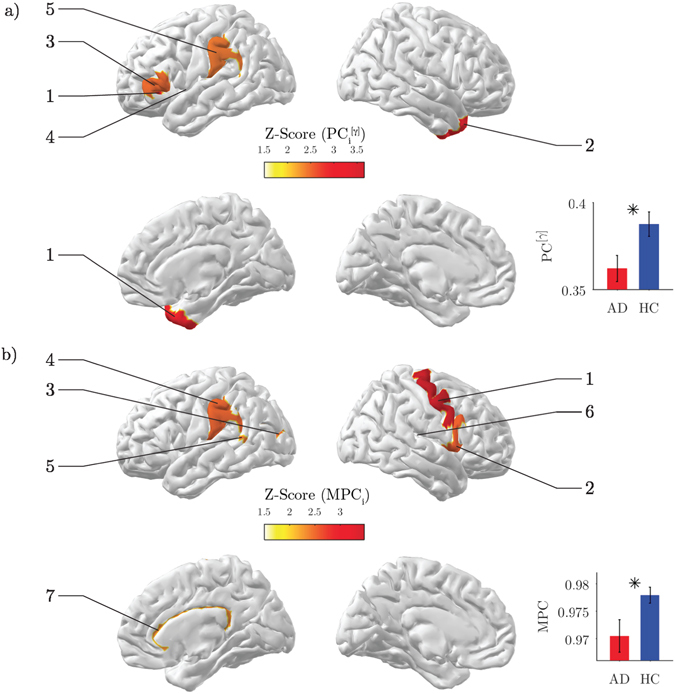
Network analysis of brain connectivity. (a) Inter-modular centrality. Statistical brain maps of group differences for local participation coefficients PC i in the gamma band. Only significant differences are illustrated (p < 0.05, FDR corrected). The labels same ranks are used as labels. The inset shows the results for the global PC; vertical bars stand for group-averaged values while error bars denote standard error means. In both cases, Z-scores are computed using a non-parametric permutation t-test. b) Inter-frequency centrality. Statistical brain maps of group differences for local multi-participation coefficients MPC i. The inset shows the results for the global MPC; same conventions as in (a).