
Figure 4.
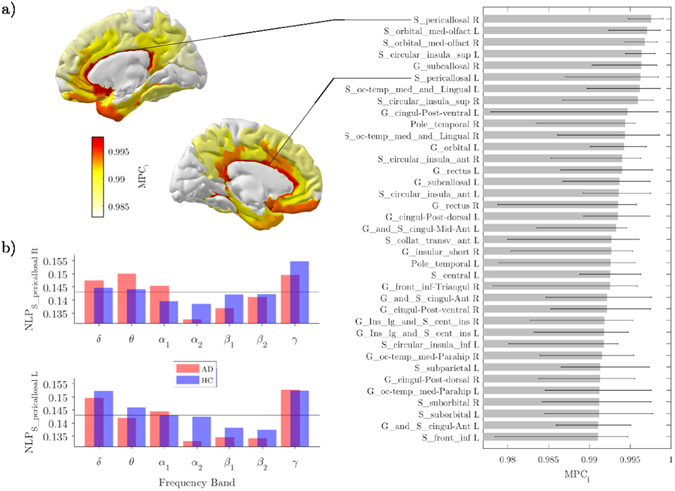
Inter-frequency hub centrality distribution. (a) The median values of local multi-participation coefficients (MPC i) are shown over the cortical surface for the healthy group. Only the top 25% is illustrated for the sake of visualization. The corresponding list of ROIs is illustrated in the horizontal bar plot. (b) Group-median values of the node-degree layer proportion (NLP i) for the right and left cingulate cortex. The grey line corresponds to the expected value if connectivity were equally distributed across frequency bands (NLP i = 1/7).