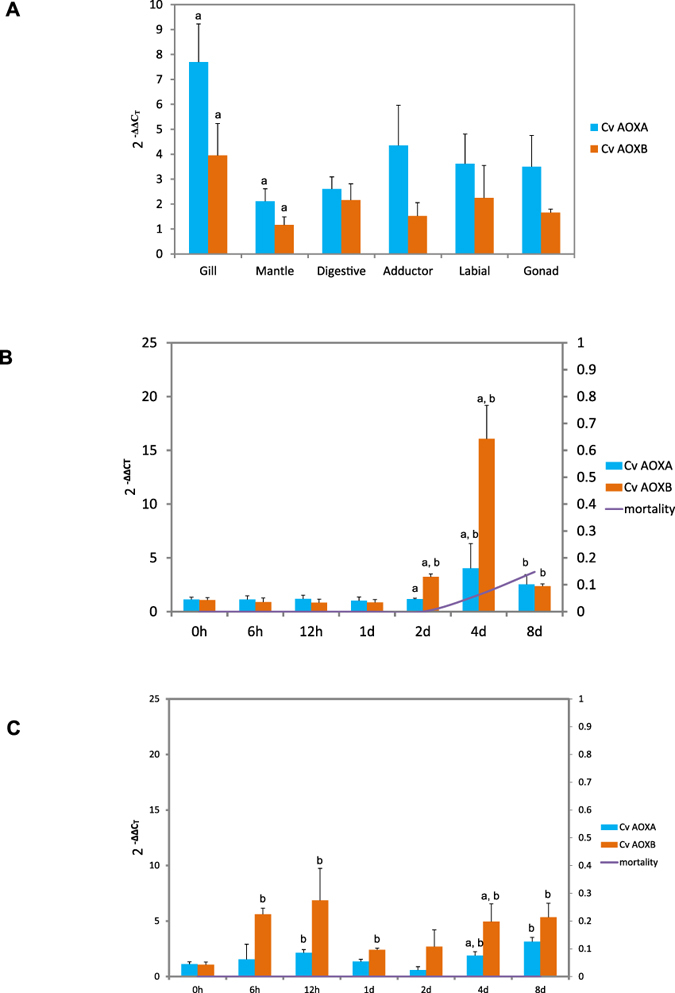
Figure 5.

(A) Expression profile of CvAOXA and CvAOXB in different organs of C. virginica. Relative expression (y-axis) is calculated using 2−ΔΔCт standardized by the lowest expression of CvAOXB in mantle. Error bars are standard errors. (B) Relative expression of CvAOXA and CvAOXB in gill under air exposure at 25 °C. (C) Relative expression of CvAOXA and CvAOXB in gill under air exposure at 5 °C. Expression levels of control samples (in water) in each time set are used as references. Lines and the secondary axis (right) show the mortality. Letter a designates significant difference between CvAOXA and CvAOXB. Letter b designates significant difference between challenged and control groups. Significance level is set at p < 0.05.
