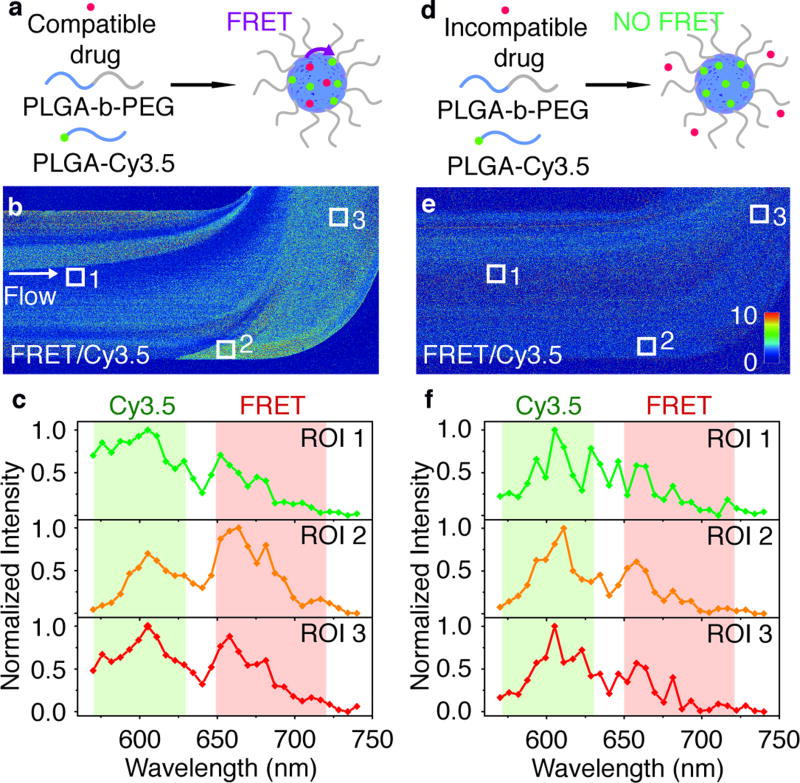
Figure 3. Real-time monitoring of PLGA-b-PEG polymer nanoparticle formation and spontaneous drug loading.
(a, b, c) Hydrophobic Cy5-OLA model drug. (d, e, f) Hydrophilic sulfo-Cy5 model drug. (a, d) Schematic illustration of drug loading and FRET mechanism. (b, e) Images of FRET/Cy3.5 intensity ratio taken at the end section of the microfluidic cham-ber. The dimensions of the images are 1.6×0.8 mm. (c, f) Emission spectra recorded at ROIs indicated in b, e. Colored regions indicate emission filters used for images in b, e.

