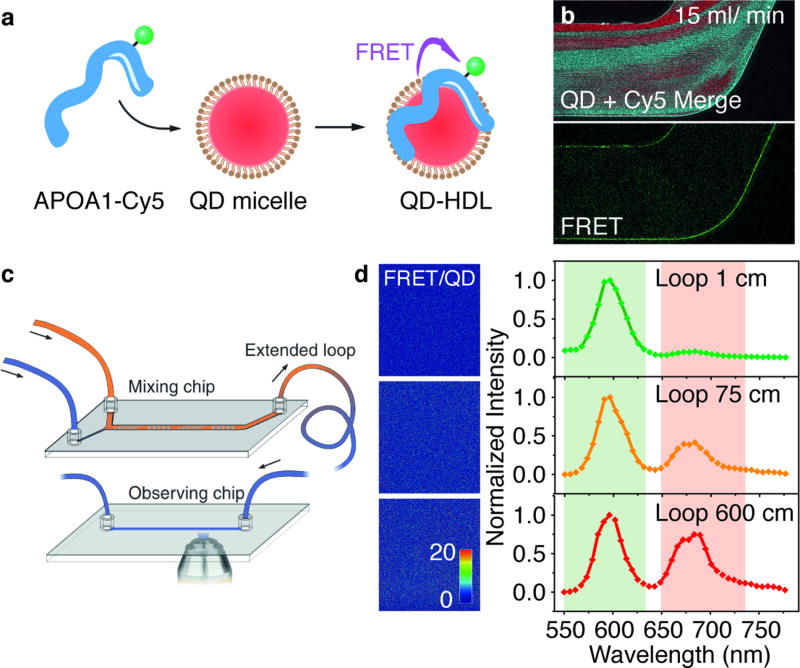
Figure 4. Real-time monitoring of QD core HDL formation.
(a) Schematic illustration of the HDL assembly and establishment of FRET. (b) Confocal imaging of the end section of the microfluidic chamber during the assembly of HDL at flow rate of 15 ml/min. The dimensions of the images are 1.6×0.8 mm. (c) Schematic of the microfluidic device and FRET imaging setup. (d) Images of FRET/Cy3.5 intensity ratio at the observation chip with indicated loop length, and the corrisponding emission spectra.

