Figure 6.
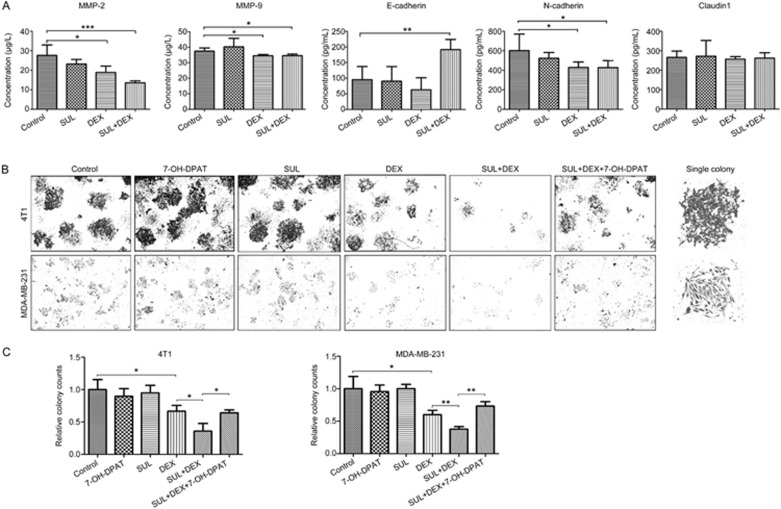
Analysis of biomarkers in 4T1 xenograft tumors and colony formation capacities of metastatic breast cancer cells. (A) Harvested 4T1 xenograft tumors at day 14 were used for EMT- and motility-related protein analyses using commercial ELISA kits. The expression of MMP-2, MMP-9 and N-cadherin was significantly decreased in the DEX-treated group, and MMP-2 expression was further decreased when SUL was added. The expression of E-cadherin was significantly increased after co-treatment with SUL and DEX. (B) Colony formation assays were conducted on 4T1 cells and MDA-MB-231 cells for 8 d after exposure to DMSO, SUL, DEX, SUL+DEX, 7-OH-DPAT, or SUL+DEX+7-OH-DPAT for 48 h. The fewest colonies in the SUL+DEX group suggested that SUL enhanced the inhibitory effects of DEX, and this effect could be reversed by 7-OH-DPAT. (C) Corresponding quantification analyses of the colony counts. The images of the view fields and representative single colonies are magnified 4× and 10×, respectively. The data are presented as the mean±SD (n=5). SUL, sulpiride; DEX, dexamethasone. *P<0.05, **P<0.01, ***P<0.001.

