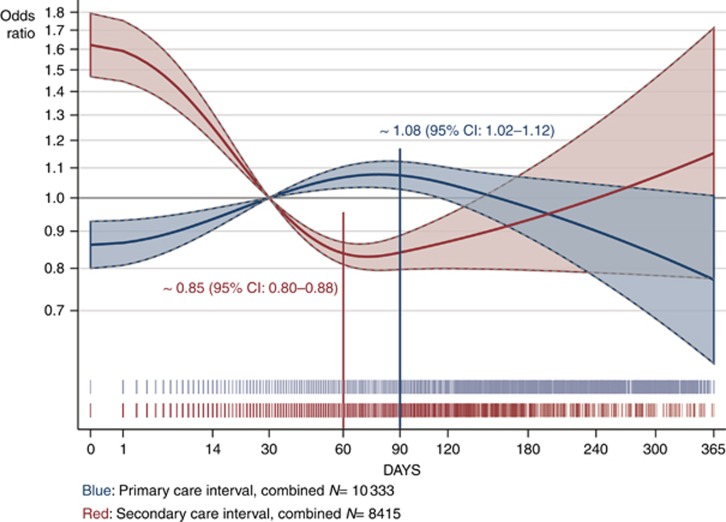
Figure 3.
The risk of being diagnosed with advanced colorectal cancer as a function of time to diagnosis. Estimated odds ratios of being diagnosed with advanced (distant or regional) vs localised colorectal cancer as a function of the length of the primary care interval (blue) and the secondary care interval (red) analysed for all cohorts combined (patients with unknown tumour stage excluded). We adjusted for age, gender, alarm symptoms and cohort. The area around the fitted curves indicates 95% confidence limits. The spikes below the curves show the distribution of the primary care interval (blue) and secondary care interval (red) on a squared scale. The grey horizontal lines indicate the chosen reference point of 30 days (see logistic regression details in Supplementary Table'4, Supplementary Material IV). Crude estimates are not shown.

