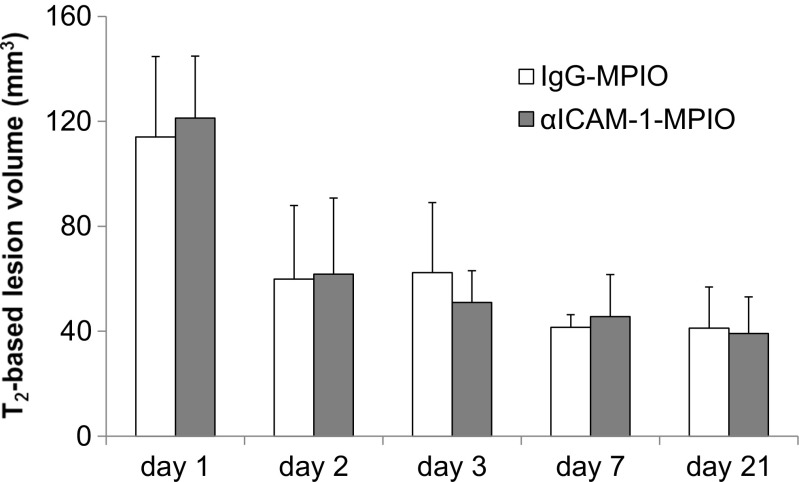
Fig. 2.
T2-based lesion volumes after stroke. Lesion volumes calculated from hyperintensity on T2 maps at days 1, 2, 3, 7, and 21 post-stroke. Bars represent mean + SD. There were no significant differences in lesion volume between mice allocated to the αICAM-1-MPIO or IgG-MPIO group at each time point

