
Figure 2.
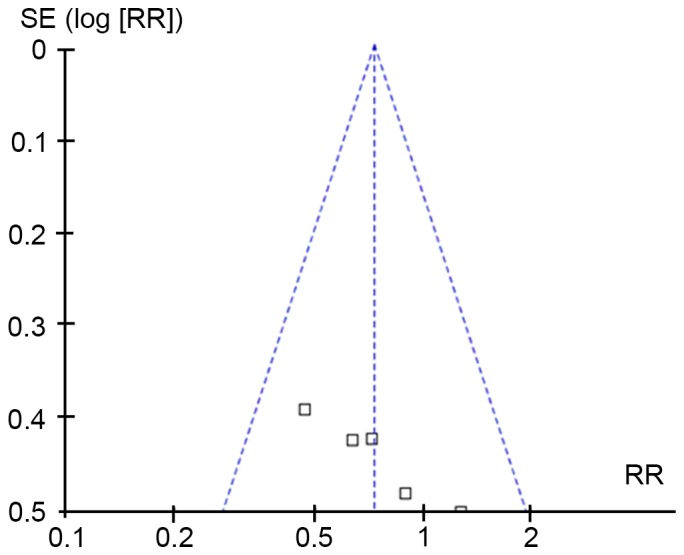
Publication bias evaluated by Begg's funnel plot. Each empty spot represents one publication. RR, relative risk; SE, standard error.
Official websites use .gov
A
.gov website belongs to an official
government organization in the United States.
Secure .gov websites use HTTPS
A lock (
) or https:// means you've safely
connected to the .gov website. Share sensitive
information only on official, secure websites.
Publication bias evaluated by Begg's funnel plot. Each empty spot represents one publication. RR, relative risk; SE, standard error.