Figure 2.

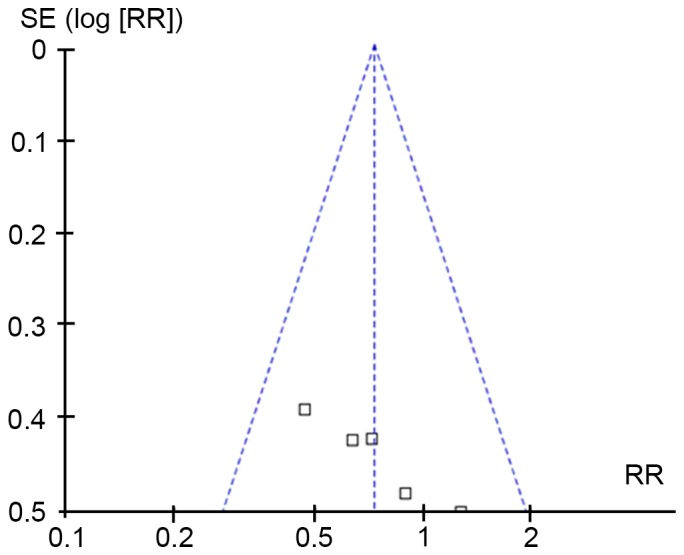
Publication bias evaluated by Begg's funnel plot. Each empty spot represents one publication. RR, relative risk; SE, standard error.

Publication bias evaluated by Begg's funnel plot. Each empty spot represents one publication. RR, relative risk; SE, standard error.