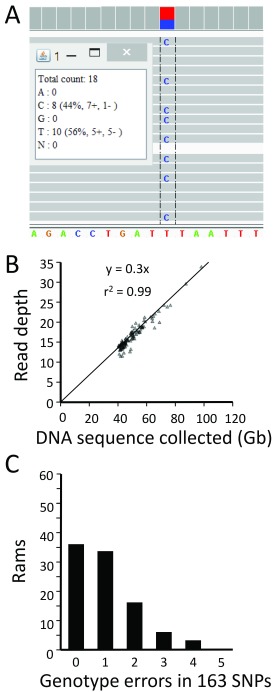
Figure 2. Comparison of 163 reference SNP genotypes with those derived from WGS data.
( A) Computer screen image of one animal’s WGS data aligned to ovine reference assembly Oar_v3.1 at a reference SNP site. The heterozygous C/T genotype is shown as viewed with the IGV software 7, 8. ( B) Linear relationship between mapped read depth and the amount (Gb) of Q20 WGS data collected. At each SNP position, the read depth and genotypes were visualized and manually recorded for 163 parentage SNPs. ( C), genotype scoring accuracy for 163 parentage SNPs in 96 sires. Consensus reference genotypes (n = 15,684) for the parentage SNPs were previously determined by multiple methods 22.

