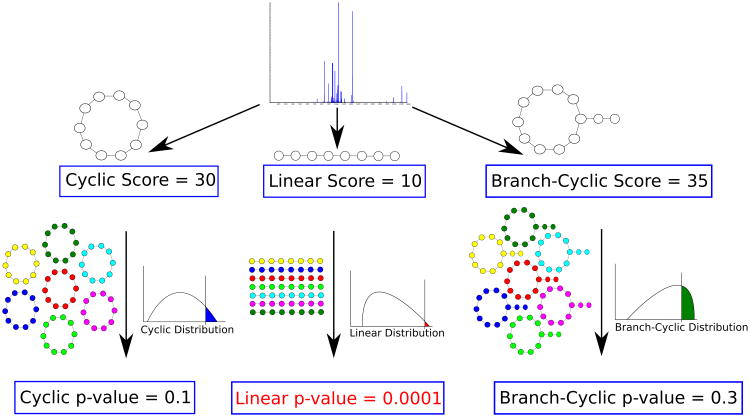
Figure 6.
Deciding whether a peptide that produced a spectrum is linear, cyclic or branch cyclic. Given a spectrum, MS-DPR considers various structure assumptions for a peptide that generated the spectrum (e.g. linear, or cyclic, or branch cyclic), and derives a p-value for each such assumption. If one of the structures results in a small p-value (e.g. linear structure with p-value of 0.0001 in Figure above), that structure is accepted as the most likely structure for a given spectrum. Note that even though the linear peptide in this example has the lowest score, it is the most statistically significant among the three structures.

