
Fig. 2.
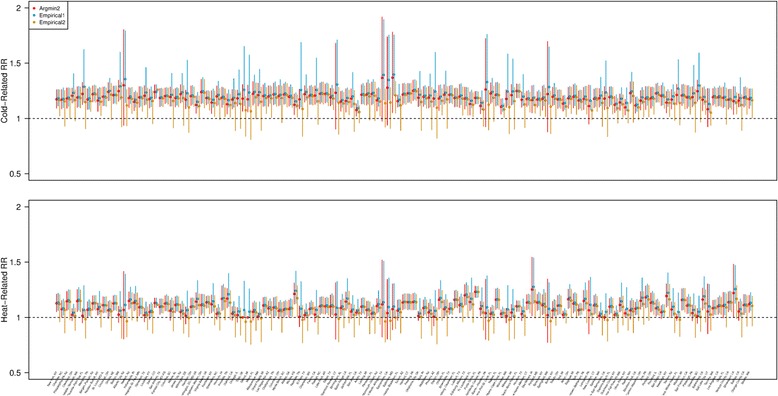
Estimated cold- and heat- related relative risk (RR) for 135 cities in the US by three different methods; Argmin2 (red), Empirical1 (blue), Empirical2minimal (orange). Points indicate the point estimate and vertical solid/dashed bars indicate 95% empirical interval estimates. Cities are ordered according to the MMT uncertainty (the length of the interval estimates obtained by Empirical1) as in Fig. 1