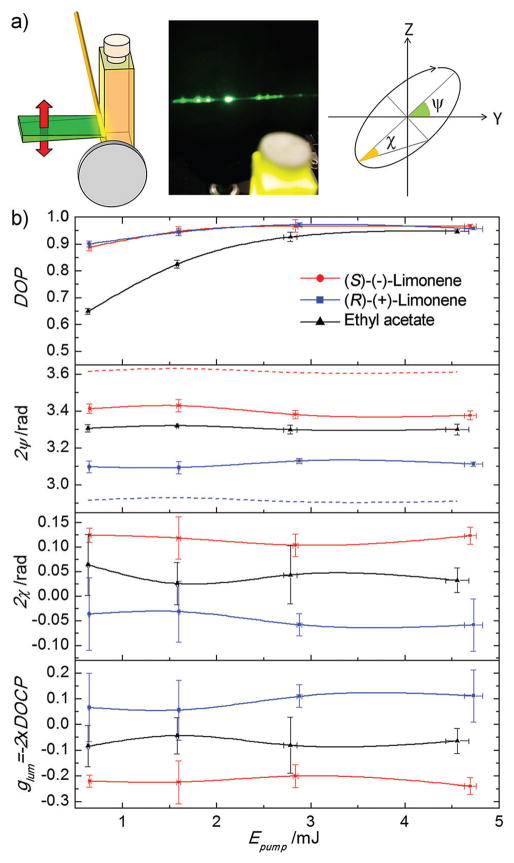
Fig. 2.
(a) Sketch of cavity and pump (in green) configuration (from a point of view coincidental with that of the picture), picture showing multi spot laser emission, and polarization ellipse. (b) Laser emission polarization state parameters as a function of pump energy for linear vertical pump polarization. Each point and error bar in (b) represents the average and standard deviation, respectively, of the fitting parameters obtained over 4 sets of measurements. Lines are guides to the eye. Dye concentration: 0.5 mM.

