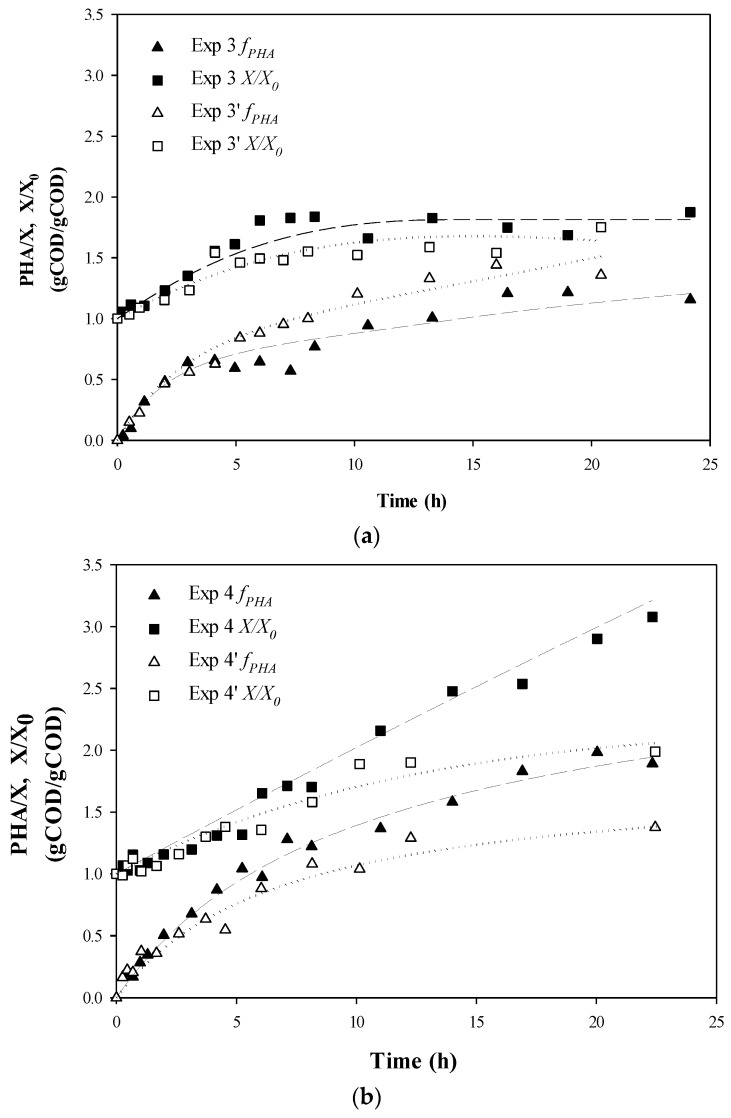
Figure 2.
Experimental data for PHA fraction and relative active biomass production: (a) Experiment set 3: 50% acetic acid and 50% propionic acid fed simultaneously; and (b) Experiment set 4: 100% acetic acid alternating with 100% propionic acid. ▲, ∆, PHA fraction respect to active biomass concentration fPHA (PHA/X); ■, □, Active biomass concentration respect to the initial biomass concentration (X/X0). Dotted lines represent fitted data. Coefficients are given on gCOD basis.

